Download
1 / 8
80 likes | 224 Views
Metrics, Graphs, Sig Figs. Pages 39-41. Graphs. Extrapolating – an estimation of a value based on extending a known sequence of values or facts beyond the area that is known. . Graphs. Interpolating – an estimation of a value within two known values in a sequence of values. .

E N D
Metrics, Graphs, Sig Figs Pages 39-41
Graphs • Extrapolating – an estimation of a value based on extending a known sequence of values or facts beyond the area that is known.
Graphs • Interpolating – an estimation of a value within two known values in a sequence of values.
Directly Proportional: • Direct proportion can be written as • Y = KX • (Y & X are directly proportional) • This means that as one increases, the other increases too! • ( & when one decreases, the other decreases.)
Inversely Proptional: • Inverse proportion can be written as • Y = K X • (Y & X are inversely proportional) • This means that as one increases, the other decreases! • ( & when one decreases, the other increases.)
Data • Accurate data – how close a measured value is to the actual (true) value. • Precise data – how close the measured values are to each other.
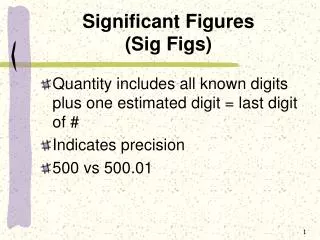
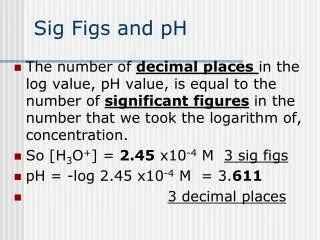
Significant Figures • Significant figures give us an idea of how well (accurately and precisely) data could be measured/recorded.
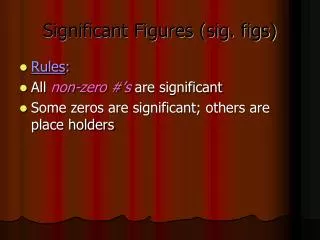
Significant Figures • ALL non-zero numbers (1,2,3,4,5,6,7,8,9) are ALWAYS significant. • ALL zeroes between non-zero numbers are ALWAYS significant. • ALL zeroes which are SIMULTANEOUSLY to the right of the decimal point AND at the end of the number are ALWAYS significant. • ALL zeroes which are to the left of a written decimal point and are in a number >= 10 are ALWAYS significant.