Download
1 / 23
230 likes | 261 Views
Bayesian analysis of a conceptual transpiration model with a comparison of canopy conductance sub-models. Sudeep Samanta Department of Forest Ecology and Management University of Wisconsin - Madison. Motivation. Mechanistic or process based conceptual models: basis for extrapolation,

E N D
Bayesian analysisof a conceptual transpiration model with a comparison of canopy conductance sub-models Sudeep Samanta Department of Forest Ecology and Management University of Wisconsin - Madison
Motivation • Mechanistic or process based conceptual models: • basis for extrapolation, • scientific understanding. • Requires: • model testing, • parameter estimation, • model discrimination through comparison. • Problem: • Most models are deterministic.
Objectives • Estimate model parameter and prediction uncertainties with a simple probabilistic error term. • Develop a methodology for comparing models that accounts for both model fit and complexity.
Bayesian approach • Probability as the mathematical expression of the degree of belief. • Direct quantification of uncertainty. • Allows for incorporating prior knowledge. • Computational advantages: • Conceptually simple, • Computationally feasible.
Bayesian approach • Unknown parameters βand σ2are random quantities. • Prior distributions describe knowledge about the parameters prior to the experiment. • Posterior distributions expresses information gained from data. • Bayes’ Rule:
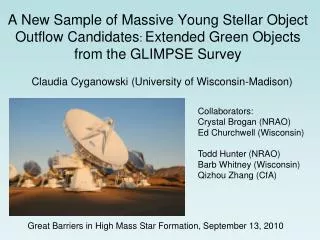
Transpiration Data 05/05/2001 09/11/2001 • Half hourly measurements made at the ChEAS site, WI: • Average transpiration from eight sugar maple trees, • Measurements within canopy - Hay Creek, WI, • Measurements above canopy - Willow Creek, WI.
Transpiration Model • Penman – Monteith Equation: • Canopy conductance: • Probabilistic Model:
Noninformative prior distribution of parameters: • βuniformly distributed within specified limits, • σ2uniform on log(σ), • joint prior density: Prior and posterior distributions • Joint posterior distribution used for MCMC:
Histograms of marginal posterior distributions • Symmetric, well defined.
Residuals • Residuals are not obviously biased or heteroscedastic. • Small systematic errors might be present.
Posterior interval for transpiration rate • Overall, the posterior density regions are consistent with the observations. • Relationship between observations and predictions inconsistent from day to day.
Conclusions drawn from uncertainty analysis • Possible to obtain estimate of error variability. • Bayesian approach is useful: • to estimate parameter values, • to estimate uncertainties associated with the parameters and predictions. • These uncertainties may be considerable and should be taken into account when drawing inferences from data. • Systematic errors → consider: • Other transpiration models, • Collection of other data might improve the modeling.
Comparison of canopy conductance sub-models
Model comparison metric Deviance Information Criterion (DIC): • A penalized criterion that combines Bayesian measures of model complexity and fit. • Explicitly accounts for prior and posterior distributions. • Can be used for comparing models of arbitrary structure. • Can be used in situations where all possible models cannot be specified ahead of time. [Spiegelhalter et al., 2002]
Measure of fit in DIC • “Bayesian deviance”, in this case:
Effective number of parameters, pD: where = posterior mean of the deviance, and = deviance at the posterior estimates of the parameters. • Measures of fit and complexity combined to define DIC as: Measure of complexity in DIC Model comparison metric: DIC
Canopy conductance sub-model • Canopy conductance: • Where: • gSmax, highest conductance per unit leaf area (mol m-2 s-1), • Lmax, maximum leaf area index, • D, vapor pressure deficit within canopy (kPa), • Qp, average PAR photon flux density (mmol m-2 s-1), • Tc, canopy air temperature (˚C), • Ψs, soil water potential (MPa), • lfdoy, fitted transpiration (mm s-1).
Constraint functions • Estimated parameters: gSmax,δ, δh, A, Ψ0, To, Tlo, Thi, andlfscl.
Marginal posterior distributions for MC7 • Distributions for Ψ0, To, Tlo, andThiare skewed, • Very wide 95% posterior intervals.
Results of comparison using DIC • Increased model complexity did not always improve DIC.
Conclusions drawn from model comparison • DIC is useful as a metric to identify an appropriate conceptual model for a given set of data. • DIC helps in the development of more refined models. • Some of the parameters in an overly complex model may be poorly identified based on the information available in the data. • Future data collection efforts may be directed by: • data requirements of proposed models, • need for better parameter identification.
Future research • Usability and effectiveness of this methodology with other models and data. • Use of informative priors. • Use of other error models. • Use of the methodology for models with more than one observed output or spatially distributed output.