Download
1 / 16
160 likes | 176 Views
This report describes the cooling process of stave modules in a freezer and compares the performance of each module before and after irradiation.

E N D
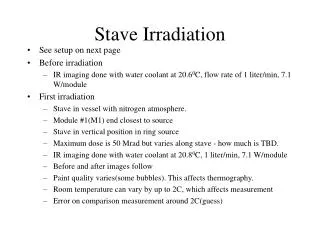
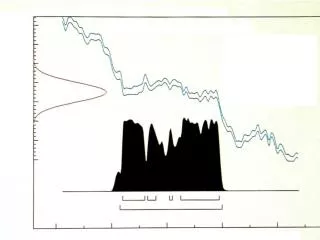
Stave After 1st T Cycle • Stave placed in freezer - see temperature plot next page • Operating conditions • Flow - 1.03 l/min • Inlet temp - 21.0 degrees • Differential pressure - 5.08 psi • Power/module = 7.0 to 7.1 watts • Platinum apparently scraped off of modules 2 and 6 during paint removal cycles, open so no heat load on these. Will attempt to repair later. • This makes comparison not so simple since total heat load is affected. • Also note ambient temperature warmer than before. Set up was moved to different room. • Nevertheless looks OK after 1st cycle. • Setting up to do faster cycling using LN2 but have to see if this works
Before Irradiation After 1st Temp. Cycle After 1st irradiation After 2nd irradiation
Module 1 - Before Module 1 - After
Module 2 - Before Module 2 - After
Module 3 - Before Module 3 - After
Module 4 - Before Module 4 - After
Module 5 - Before Module 5 - After
Module 6 - Before Module 6 - After