Download
1 / 45
450 likes | 468 Views
Explore the statistics on patients, transplants, deaths, and treatments in Australia and New Zealand between 1990 and 1997. Analyze the number of new patients, functioning transplants, dialysis methods, patient demographics, and survival rates during this period. Understand the prevalence, incidence, and outcomes of dialysis and transplants among specific populations such as Aboriginals and Maoris. Delve into the progression of healthcare in these regions over the years through detailed figures and data representation.

E N D
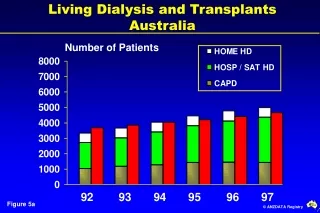
Living Dialysis and TransplantsAustralia Number of Patients 92 93 94 95 96 97 Figure 5a
New Patients - Australia Number of New Patients Figure 5b
Transplants Performed - Australia Number of Transplants Figure 5c
Deaths - Australia Number of Deaths Figure 5d
Living Dialysis and TransplantsNew Zealand Number of Patients 92 93 94 95 96 97 Figure 6a
New Patients- New Zealand Number of New Patients Figure 6b
Transplants Performed - New Zealand Number of Transplants Figure 6c
Deaths - New Zealand Number of Deaths Figure 6d
Patients Alive: Functioning Transplant or Dialysis1987-1997 Australia Patients Per Million Figure 7a
Patients Alive: Functioning Transplant or Dialysis1987-1997 New Zealand Patients Per Million Figure 7b
Transplant and Dialysis Patients per YearAustralia Patients Per Million Figure 10a
Transplant and Dialysis Patients per YearNew South Wales Patients Per Million Figure 10b
Transplant and Dialysis Patients per YearQueensland Patients Per Million Figure 10c
Transplant and Dialysis Patients per YearVictoria Patients Per Million Figure 10d
Transplant and Dialysis Patients per YearSouth Australia Patients Per Million Figure 10e
Transplant and Dialysis Patients per YearWestern Australia Patients Per Million Figure 10f
Treatment of Aboriginal PatientsAustralia 1990 - 1997 Number of Patients at 31st December Figure 11
Treatment of Maori PatientsNew Zealand 1990 - 1997 Number of Patients at 31st December Figure 12
Treatment of Pacific Islander PatientsNew Zealand 1990 - 1997 Number of Patients at 31st December Figure 13
Method and Location of Dialysis 1990 - 1997 Australia Number of Patients 31-Dec-97 1490 (29%) 1447 (28%) 1436 (28%) 622 (12%) Figure 14
Method and Location of Dialysis 1990 - 1997 New Zealand Number of Patients 31-Dec-97 543 (54%) 239 (24%) 187 (18%) 12 (1%) Figure 15
Dialysis Population Per Million 1992 - 1997States: Australia and New Zealand Patients Per Million No. Pts 1997 805 1986 1321 109 316 492 5174 1014 145 Figure 16
New Patients (Per Million) Australia 1991 - 1997 No. Pats. 1468 981 1086 1160 1316 1387 1431 Figure 17a
New Patients (Per Million) Australian States 1997 No. Pats. 141 268 520 357 30 96 56 Figure 17b
Age of New Patients - Australia 1997 New Patients (1468) Median Age 58.4 yrs Per Million Age Group 5 8 21 44 66 100 194 301 183 5 Diabetic % 0 0 2 11 28 30 25 22 9 0 Type 1 0 0 2 9 13 6 1 <1 0 0 Figure 18
Acceptance of New Patients 1990 - 1997 Age Specific Rates - Australia Patients Per Million Figure 19
Deaths Diab Pts Risk Deaths NonDiab Pts Risk Annual Death Rate Per 100 Dialysis Patient YearsAustralia 1993 - 1997 All Patients 15.6 15.3 15.0 15.6 15.7 88 104 117 137 156 507 624 769 896 1033 465 493 532 595 638 4175 4511 4838 5177 5421 Figure 20
Deaths CAPD Pts Risk Deaths HD Pts Risk Annual Death Rate Per 100 Patient YearsMode of Dialysis Australia 1993 - 1997 176 199 215 278 248 1730 1873 2065 2151 2161 365 390 421 432 527 3487 3816 4125 4465 4829 Figure 21
Graft Loss in Relation to Grafts at RiskAustralia 1990 - 1997 No. Grafts Lost 262 285 260 248 228 241 264 237 Figure 22
Australian Transplantation 1990 - 1997 12 month graft survival CD1 86 84 86 85 91 90 89 Figure 23
No. Patients Proportion of Patients Awaiting Transplant 31-Mar-98 Australia 30% % of Age Group Patients 1562 Patients Age Group 4 22 89 241 356 445 325 80 0 Figure 24
Transplantation Rate 1997 Related to Patients Dialysed Australia 7.7% Figure 25a
Transplantation Rate 1997 Related to Patients Dialysed New Zealand 8.8% Figure 25b
Transplant Operations (Per Million)Australian States 1997 Australia 27 (n=502) No. Grafts 96 177 120 9 49 17 34 Eight Tasmanian residents transplanted in Vic, one in NSW Fifteen NT residents transplanted in SA, two in QLD Figure 26
Transplant Operations PerformedAustralia 1990 - 1997 Operations Per Million No. Grafts Figure 27
Age Group Dependence on Functioning Transplants Australia 1997 Total RRT (9930) Transplants (4656) (21) (110) (380) (1094) (1613) (2036) (2130) (1898) (534) (14) Figure 28a
Age Group Dependence on Functioning Transplants New Zealand 1997 Transplants (881) Total RRT (1895) (3) (31) (86) (250) (365) (454) (411) (249) (45) (1) Figure 28b
Functioning Transplants 1990 - 1997Transplanting States: Australia and NZ Patients Per Million No. Pats 1997 894 1628 1219 540 375 4656 881 Figure 29
Functioning Transplants (Per Million)Australia and New Zealand 1992 - 1997 Figure 30
Functioning Transplants (Per Million)Caring Australian States 1997 Figure 31
Primary Cadaver Patient Survival 1990 - 1996 Related to Year of Transplant Australia Patient Survival Figure 32
Primary Cadaver Graft Survival 1990 - 1996 Related to Year of Transplant Australia Graft Survival Figure 33
Prevalence and Incidence 1990 - 1997Aboriginals - Australia Number of Patients ( ) Per Million Dialysis (1240) New Pts (435) Functioning Transplant (282) Deaths (220) Transplant Ops (61) Figure 34
Prevalence and Incidence 1990 - 1997Maoris - New Zealand Number of Patients ( ) Per Million Dialysis (632) New Pts (208) Functioning Transplant (164) Deaths (141) Transplant Ops (21) Figure 35
Prevalence and Incidence 1990 - 1997Pacific Islanders - New Zealand Number of Patients ( ) Per Million Dialysis (786) Functioning Transplant (203) New Pts (153) Deaths (74) Transplant Ops (20) Figure 36