Download
1 / 18
180 likes | 303 Views
NetInsight Demonstration. 10 October 2007 http://ems.eos.nasa.gov. NetInsight Home Page. Use the Options tab on the Home Page to change your password. Specific page help, NetInsight User Guide, and Glossary. Logout. NetInsight User Interface. Profile Controls. Icon Toolbar.

E N D
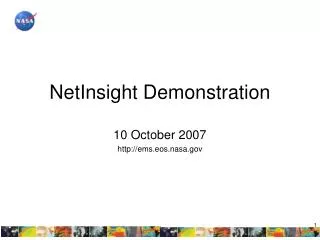
NetInsight Demonstration 10 October 2007 http://ems.eos.nasa.gov
NetInsight Home Page Use the Options tab on the Home Page to change your password Specific page help, NetInsight User Guide, and Glossary Logout
NetInsight User Interface Profile Controls Icon Toolbar Calendar controls active reports Categorized and expandable menu
Report Features Filters Graph controls Active report graphs can be clicked to drill down in reports View Right click menus are available in certain areas of the user interface for advanced drill down Dimension Metrics
Backup Slides The following slides are provided as reference information for quick lookup.
Getting Started with Page Tagging • Get page tag zip file from EMS web site and unzip it http://ems.eos.nasa.gov/downloads/ntpagetag.zip • Put page tag script, ntpagetag.js, in a publicly accessible web directory • Edit the HTML tag insert to point to the page tag script • Paste the page tag below in each of your web pages • Send EMS your Page Tag Manifest / start UAT
NetInsight Icon Toolbar Discovery Panel Report Designer Export Sticky Filters E-mail Comparative Reports Print A/B Testing NetInsight Home
Calendar Controls View Year View Quarter View All View Month View Custom
Category Menu Default View
Profile Controls - Reports view the reports that contain this profile’s data
Profile Controls - Custom create new reports
Profile Controls - Options Configuration settings for your profile
Acronyms • DAAC - Distributed Active Archive Centers • EMS – ESDIS Metrics System • EOS - Earth Observing System
Definitions • A/B Report – a standard report with more than one dimension; enables you to analyze the relationship between two arbitrary values • Comparative Report - a view of the report data for two different time periods in the same report; can only be created using the Comparative Reports icon • Crosstab Report – a standard report with more than one dimension; enables you to analyze the relationship between two arbitrary values • Custom Dashboard - displays a variety of graphs and overview statistics taken from the reports you specify • Dashboard - a component that displays data without performing an operation on it first; in all reports except crosstab reports, only one column displays a dimension represent a single type of data, such as a date or user
Definitions • Dimension – displays a single type of data without performing an operation on it first; the dimension value is the value stored in the report column next to the row number • Discovery Panel - displays or hides the Discovery Panel; used to narrow the results displayed in the current report to a subset of the displayed data or add metrics or dimensions to the current report • Drill-down – dynamically link to additional relevant details of reported metrics; Items that have additional details available are highlighted and underlined • EMS – a system that collects and organizes various metrics from the EOS DAACs and other Data Providers • Export- saving report data to a different format such as a spreadsheet, database, or word processor
Definitions • Filter - value to which data is compared. Filter matches are included in the resulting report • Metric - a component that displays the result of applying an operation to the data; most of the columns in a NetInsight report display metrics • Path Summary – an analysis of the most common paths visitors travel on your site • Profile - a collection of reports that analyze the same Web site, proxy server, firewall, FTP servers, etc. • Report - a summary, breakdown, or dashboard. Reports present the data in the profile • Report Designer - displays the Report Summary page, where you can edit the report
Definitions • Scenario Report – a view of the report data for two sets of filters in the same report. • Standard Report - shows selected metrics calculated for one dimension • Sticky Filters - turns sticky filters on or off. When filters are sticky, any currently-applied filters are kept and re-applied when you switch to a new report. When filters are not sticky, filters from one report do not carry over to another report • Trend Report - enable you to analyze the number of views or visits for one or more (up to ten) subsets of data over time • View (Page) - a hit to a Web page, excluding error hits and hits to user-defined files such as images, style sheets, Java applets, and specific redirects
Definitions • View (Interface) - a collection of reports, both predefined and custom, organized into a set of folders. • Visit - a series of consecutive views of a Web site by the same visitor