Download
1 / 2
20 likes | 189 Views
Developing Custom GIS Applications to Explore Digitally Vectorized Geologic Quadrangles Mark Graham, Dr. Andrew Wulff, Department of Geography and Geology, Western Kentucky University, mark@geospace.co.uk.

E N D
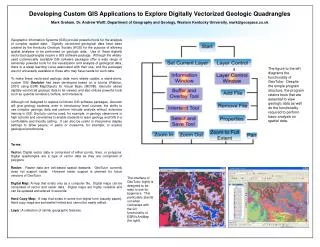
Developing Custom GIS Applications to Explore Digitally Vectorized Geologic Quadrangles Mark Graham, Dr. Andrew Wulff, Department of Geography and Geology, Western Kentucky University, mark@geospace.co.uk Geographic Information Systems (GIS) provide powerful tools for the analysis of complex spatial data. Digitally vectorized geological data have been created by the Kentucky Geologic Society (KGS) for the purpose of allowing spatial analyses to be performed on geologic data. Use of these digitally vectorized quadrangles require a GIS software package. Although the widely-used commercially available GIS software packages offer a wide range of extremely powerful tools for the visualization and analysis of geological data, there is a steep learning curve associated with their use, and the packages are not universally available to those who may have needs for such data. To make these vectorized geologic data more widely usable, a stand-alone, custom GIS Geotutor has been developed based on a tutorial (Ralston, 2001) using ESRI MapObjects for Visual Basic (MOVB). Geotutor allows digitally vectorized geologic data to be viewed, and also utilizes powerful tools such as quantile renderers, buffers, and intersects. Although not designed to replace full-blown GIS software packages, Geotutor will give geology students, even in introductory level courses, the ability to use complex geologic data and perform intricate analysis without extensive training in GIS. Geotutor can be used, for example, in geology classrooms in high schools and universities to enable students to learn geology and GIS in a comfortable and friendly setting. It can also be useful in interpretive display settings to allow people, in parks or museums, for example, to explore geological phenomena. Terms: Vector: Digital vector data is comprised of either points, lines, or polygons. Digital quadrangles are a type of vector data as they are comprised of polygons. Raster: Raster data are cell-based spatial datasets. GeoTutor currently does not support raster. However raster support is planned for future versions of GeoTutor. Digital Map: A map that exists only as a computer file. Digital maps can be comprised of vector and raster data. Digital maps are highly versatile and can be updated and altered in seconds. Hard Copy Map: A map that exists in some non-digital form (usually paper). Hard copy maps are somewhat limited and cannot be easily edited. Layer: A collection of similar geographic features. The figure to the left diagrams the functionality of GeoTutor. Despite the simple program structure, the program retains tools that are essential to view geologic data as well as the functionality required to perform basic analysis on spatial data. The interface of GeoTutor (right) is designed to be easy to use for beginners. This particularly stands out when contrasted with the full functionality of ESRI’s ArcMap (far right).
Features can be selected from each layer. Selected features can be buffered, saved as new files, or intersected with other layers. Information from the layer’s attribute table can be displayed from the selected feature(s). In this example, the X formation has been selected. The attribute table displays rock code and the area it covers. • Using GeoTutor for an Introductory Lab on Geological Maps • Starting map has all of the layers on a static display, similar to the information on a typical paper/hard copy map • Using Geotutor, the student may choose to view just the surface elevations (typical topography/contour map). Questions that may be asked at this stage include identifying types of drainages and using the “Law of Vs” to predict direction of stream flow. Contour density is easy to compare by using the Zoom feature. • At this stage, the student may add the surface hydrology and compare predictions with actual drainages and flow directions. • The student may choose to remove the surface hydrology and simply look at the bedrock geology layer. Questions at this stage may focus on the patterns of the contacts between lithologic units, or floodplain and drainages. • By adding the surface hydrology to the bedrock layer, the student may clearly see the relationship between the two features. Students can clearly discern that varying surface hydrology elements reflect in the varying geology or vice versa. • At this stage, the student may compare surface topography with bedrock geology and answer questions about the orientation of the beds. Students can determine a given bedrock unit’s strike and dip from topographic and geologic data. Multiple layers can be displayed at the same time. Each layer can be symbolized in a unique way. The order of layers can also be set. In this example, contour lines are places on top of a geology layer. Geology can be symbolized in a variety of ways. Unique values display features based on an attribute value. For example, each rock type could be drawn with a specific color. The quantile renderer displays a series of symbols whose colors change according to the value of a particular attribute. A buffer is a zone of specified distance around features (ESRI, 2004). The buffer and overlay tool will create a buffer and assign that buffer values based on an overlay layer. The intersect function will select features from the current layer which intersect selected features of a specified layer. Geotutor was developed at the Western Kentucky University GIS Research and development laboratory and borrows heavily from tutorials in “Developing GIS Solutions with MapObjects and Visual Basic” (Ralston, 2001). The program is still is the initial stages of development. Future modifications will include a help menu, an even simpler interface, and customized data intended for use in geology classrooms. Geologic quadrangles have only recently been digitally vectorized in the Commonwealth of Kentucky. GeoTutor makes use of these quadrangles and other existing GIS data. In order for the program to be a useful educational tool in other regions, digitally vectorized geologic quadrangles from other states and specific classic geologic quads should be integrated in the program. Maps are not static. The user can zoom and pan to explore geologic formations. The ‘zoom in’ feature causes the scale of the map to get larger. The ‘zoom out’ feature results in the scale of the map becoming smaller. The ‘pan’ tool allows the user to move around the map without altering scale in order to investigate different areas. Acknowledgements: Ralston (2001), Kevin Cary, Western Kentucky GIS Research and Development Laboratory, Western Kentucky University Department of Geography and Geology, ESRI, KGS. References: Ralston, B. (2001). Developing GIS Solutions with MapObjects and Visual Basic. New York: OnWord Press. http://www.esri.com/software/mapobjects/ http://www.uky.edu/KGS/