Download
1 / 15
150 likes | 171 Views
This unit educates students on the impact of nutrient pollution on water systems, focusing on algae blooms resulting from fertilizer runoff. Students conduct experiments to measure water quality and explore human impacts on local water sources. The unit concludes with project-based learning activities.

E N D
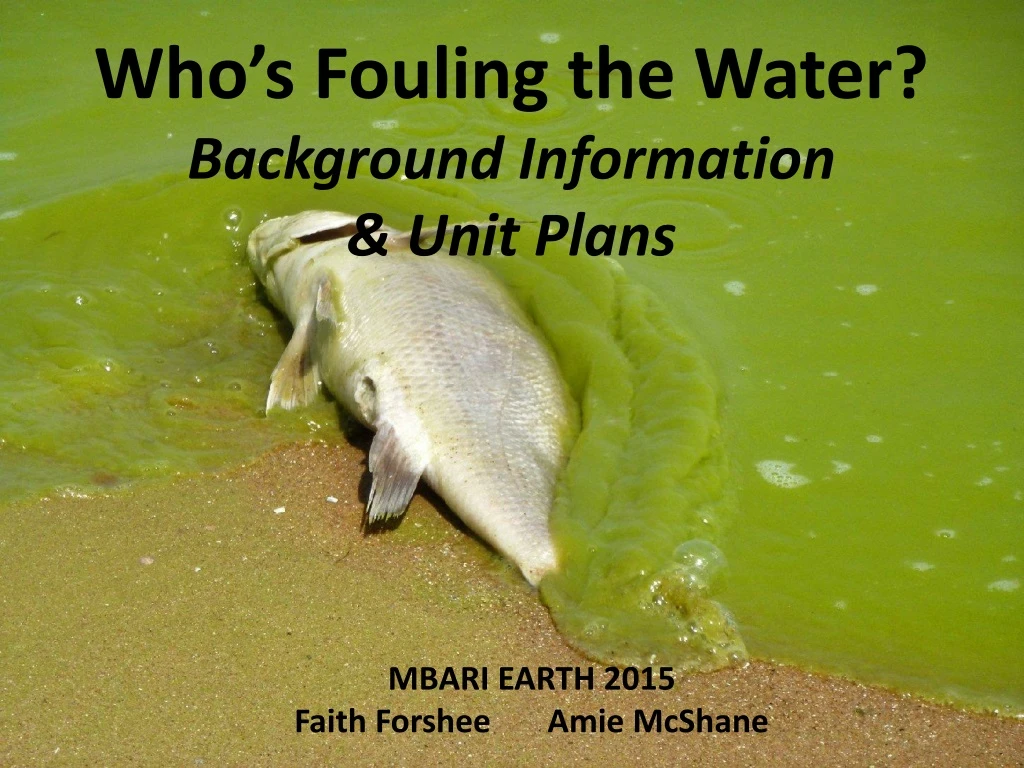
Who’s Fouling the Water? Background Information & Unit Plans MBARI EARTH 2015 Faith Forshee Amie McShane
Background Information Water is polluted in many different ways: Surface Water, Ground Water, Microbial, Oxygen Depletion, Suspended Matter, Chemical, and Nutrient Pollution. This unit of study focuses on Nutrient Pollution.
Nutrient Pollution Chemicals that are essential for growth of living things: Nitrogen Phosphorus Potassium Carbon Sulfur Calcium Iron Manganese Boron Cobalt • Nutrients, such as Phosphorus, Nitrogen, and Potassium are found in both organic and chemical fertilizers. • Farmers add it to their fields. • Animals add it through manure. • Homeowners add it to their lawns, gardens, and flowers.
After rains, those fertilizers can wash into water systems and supply aquatic plants and algae with too many nutrients. As a result, they grow and multiply faster. This can lead to an “algal or algae bloom”.
A small increase in algae has no adverse effects on the ecosystem and can even lead to an increase of certain fish populations. An overgrowth, however, can lead to an algal bloom which may disturb the water. The algae may keep out the light and when they eventually die, they are decomposed by bacteria which consume oxygen in this process so that the water may become temporarily hypoxic which may be toxic to aquatic life. Algae blooms may be visible as a scum on the surface of the water (above) or as turbid, colored water (left).
Eutrophication Article www.bbc.co.uk
Unit Plan • Students will: • Test Control Sample and Fertilizer Sample hourly/daily • Chart/graph data • Look for patterns and create a hypothesis • Identify human impact on water systems
Day 1 • Students begin thinking about human impact on water quality by doing a “gallery walk” and answering questions on posters around the room: • What do you think lives in the water of Eckman Lake? (Use the lake/stream/river/ocean of your choice.) • What are some of the interactions that happen in the water at Eckman Lake? • What are some of the positive human impacts on Eckman Lake? • What are some of the negative human impacts on Eckman Lake? • Through discussions…. • Students will identify what they already know. • Come up with questions that will drive their study. • Make predictions about how fertilizers will affect their local water source.
Day 2 • Teacher will introduce the previously gathered water from the local water source, and discuss the parameters and requirements of the study. • Two jars will be labeled and filled: Control and Fertilized • Students will take data measurements (through vernier probes or chemical kits) and record in their data sheets. Students will make visual observations, and notice the smells. Students will note their observations in their journals. • And then…. • Students will make predictions in their journal about what will happen when a commercial fertilizer is added to their water. • Add the fertilizer to the Fertilized jar!
Following Days • Students will test hourly/daily for multiple measurements: • Temperature • Dissolved Oxygen • pH • Phosphorus • Nitrogen • Turbidity • Did they get it? • Students will chart the measurements over several days. • They will choose two variables to graph and look for a pattern. • Students will describe the pattern and come up with a hypothesis to explain the pattern. • Students will be able to describe human impact on the water source in their community.
PBL? Hopefully! • Our hope is that teachers will turn this mini-unit into a Project Based Learning (PBL) unit. If so, they will end with having students demonstrate their learning through some fun and creative projects that they will share: • Plana community that would result in a decrease of pollutants in a local lake. How would you design the area to ensure that any fertilizer run-off did not end up the in the water? • Create an informational poster warning residents and tourists about the dangers of algae blooms in the water. • Write a news article for the local paper, or record a newscast for the local news channel, explaining the danger of an algae bloom in the local water source. • Write a letter to a local farmer, city official, or next-door neighbor persuading him or her to stop the flow of excess fertilizer into local water sources. Include specific evidence to support your claim.
Vocabulary and Assessment Menu