Download
1 / 93
940 likes | 982 Views
Explore the impact of race, culture, education, and socioeconomic factors on cognitive test performance. Discuss the challenges and solutions for improving accuracy in detecting cognitive impairments among diverse populations.

E N D
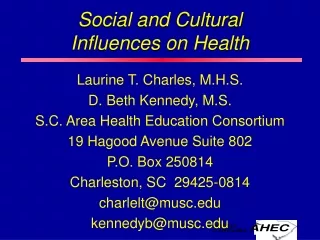
Cultural and Demographic Influences on Neuropsychological Test Scores Jennifer J. Manly, Ph.D. Columbia University Medical Center Friday Harbor 2005
National Institutes on Aging R01 AG16206 Alzheimer’s Association New York City Council Speaker’s Fund Award for Biomedical Research Friday Harbor 2005
G.H. Sergievsky Center Taub Institute for Research on Alzheimer’s Disease and the Aging Brain Yaakov Stern, Ph.D. Nicole Schupf, Ph.D. Richard Mayeux, M.D. Danurys Sanchez Cherita McDowell Judes Fleurimont Iris Paltin Raquel Cabo Akanksha Thakur Columbia University Methods in the Social Sciences Program Department of Sociology Christopher Weiss Mount Sinai School of Medicine Desiree Byrd, Ph.D. Friday Harbor 2005
The problem of low specificity of neuropsychological measures • Several studies show reduced specificity of cognitive measures among African Americans and Hispanics • Reduced specificity may result in increased misdiagnosis of cognitive impairment • Ethnic differences occur across cognitive domains
SAN DIEGO AANP IMPAIRMENT RATES for NORMAL AFRICAN AMERICANS (n = 137)
An Early Deconstruction of Race • Army Alpha & Beta tests From Klineberg, 1935
Cultural effects on test performance:WAIS-III Full Scale IQ Age, Education & Gender Corrected Age Corrected From Heaton & Taylor
PI: Richard Mayeux INWOOD WASHINGTON HEIGHTS HAMILTON HEIGHTS • N = 2,801 in 1999 • Age 65 and older • Spanish or English speaking • Education range 0 - 20 Friday Harbor 2005
Age-Specific Prevalence of Alzheimer’s Disease (1990-1992) CDR1.0
The Important Questions • How can we improve the accuracy of neuropsychological detection of MCI and AD among ethnic minorities? • Are there any measures that can be used across groups with high sensitivity and specificity? • Are separate norms or tests for ethnic minorities the best solution? • What are the cultural, linguistic, racial, educational, and socioeconomic influences on cognitive test performance? • Is AD more frequent among ethnic minorities? • What design and populations would best address this question? • If so, what are the underlying causes of this discrepancy? • Can these underlying causes be treated or changed? Friday Harbor 2005
Are there any measures that can be used across groups with high sensitivity and specificity? • Use culturally neutral or “culture-free” tests • Follows belief that there are universal constructs of cognition that can be assessed accurately across cultures Friday Harbor 2005
Failure of Universalism “…that a test or test battery is “culture free” is a description born in the never-never land of psychometric wishful thinking that at once brands the claim as spurious.” Nell, 2000
Universalism • Neuropsychologists are trained that their measures assess “pure” cognitive abilities • Universalist belief allows us to avoid issues of construct validity • Source of naitivist beliefs (vs. environmentalist claims) • BUT... tests are bound to the culture in which they are developed and normed
WHO Battery • Designed for cross-national studies • Tests were selected and created to be “culture-free” • Large cultural differences appeared on several measures, independent of years of education • Reaction time • Manual dexterity • Psychomotor speed (Digit Symbol & Color Trails) • Digit Span
Nonverbal is not culture freeRacial/ethnic differences are found on: • All WAIS-III performance subtests • Picture Arrangement • Benton Visual Retention Test • Simple Reaction Time tests • Cancellation tests
Are separate norms for ethnic minorities the best solution? • Collection of separate group norms is the most popular approach in the literature, especially among geriatric neuropsychologists Friday Harbor 2005
No significant ethnic differences in frequency of MCI Percent Manly et al, Arch Neurol (in press) Friday Harbor 2005
Disadvantages of separate norms • Used as a proxy for assumed educational, socioeconomic, or behavioral differences • Diversity within ethnic groups: • educational • geographical • economic • exposure to Mainstream culture • Separate norms leave ethnic differences unexplained and open for misinterpretation Friday Harbor 2005
American Indian or Alaska Native US CENSUS CLASSIFICATIONS Black or African American Native Hawaiian or Pacific Islander White Asian Hawaii Guam Samoa African American Haiti Jamaica West Indian Europe Middle East North Africa Cambodia China India Japan Korea Malaysia Pakistan Philippine Islands Thailand Vietnam 500 different tribes Hispanic or Latino Cuban Mexican Puerto Rican Dominican South or Central American Other Spanish origin
What are the cultural, linguistic, racial, educational, and socioeconomic influences on cognitive test performance? • Deconstruct race and ethnicity Friday Harbor 2005
DECONSTRUCT RACE/ETHNICITY • Measure factors that vary within and between ethnic groups • Determine relationship to test performance • Adjust for significant factors before interpreting scores, regardless of race
CULTURAL EXPERIENCE • Acculturation = level at which values, language, and cognitive styles are shared with ethnic community versus those of the dominant culture
OPERATIONALIZING CULTURE ACCULTURATION TRADITIONAL ETHNIC UNACCULTURATED MAINSTREAM ACCULTURATED
OPERATIONALIZING CULTURE High Majority acculturated bicultural High Ethnic Low Ethnic unacculturated “marginal” Low Majority Friday Harbor 2005
African American Acculturation Scale Preference For African American Things 1. Most of the music I listen to is by Black artists. 6.Most of my friends are Black. Traditional Childhood 17. I went to a mostly Black elementary school. 19. I grew up in a mostly Black neighborhood. Religious Beliefs And Practices 10.I am currently a member of a Black church. 12.The church is the heart of the Black community. Selected items from “The African American Acculturation Scale II: Cross-validation and short form,” by H. Landrine and E.A. Klonoff, 1995, Journal of Black Psychology, 21, p. 136.
Hispanic Acculturation Scale Solo Español Español mejor que Inglés Ambos por igual Inglés mejor que Español Solo Inglés 1. Por lo general, que idioma(s) lee y habla usted? 6.Por lo general, en que idioma(s) son los programas de television que useted ve? 17. Sus amigos y amigas mas cercanos son: Selected items from Marin, Gerardo; Sabogal, Fabio; Marin, Barbara V; Otero-Sabogal, Regina; et al. Development of a short acculturation scale for Hispanics. Hispanic Journal of Behavioral Sciences. 9 ,1987. Solo Español Español mejor que Inglés Ambos por igual Inglés mejor que Español Solo Inglés Solo Latinos Mas Latinos que Americanos Casi mitad y mitad Mas Americanos que Latinos Solo Americanos
Puente & Ardila2000 • Acculturation may be most critical factor in assessment of Hispanics • What we measure = whether patient understands and answers questions in a manner that examiner feels is “normal” • This is determined by acculturation • We do not directly determine if there is brain damage - we infer it through performance (acculturation)
San Diego African American Neuropsychological Norms Project (AANP) • Exclusion criteria: • current or past drug dependence • serious mental illness • HI with LOC > 5 minutes • neurological disorder • urine analysis performed day of testing
MEASURES • Neuropsychological battery • Acculturation • self report - African American Acculturation Scale • linguistic - Black English use
BLACK ENGLISH USEan objective measure of acculturation • Language sample recorded during Story Memory Test • Transcribed X 2 • Good interrater reliability • Coded for certain Black English variants
RESULTSAMONG NORMAL AFRICAN AMERICANS • Unacculturated African Americans obtained lower scores on measures of verbal skills, even after accounting for age, education, and gender • Linguistically unacculturated African Americans obtained lower scores on measures of nonverbal abstraction and verbal skills
San Diego HIV Neurobehavioral Research Center (HNRC) • Exclusion criteria: • non-HIV related neurological or medical disorder • past IV drug use • substance dependence • HI with LOC > 30 minutes • serious mental illness
RESULTSAMONG HIV+ INDIVIDUALS • Self-reported acculturation accounted for existing ethnic group differences • abstraction, visuospatial ability, figure learning, verbal skill • NOT STORY LEARNING • gist vs. detail
ELDERLY PARTICIPANTS • No stroke, Alzheimer’s or Parkinson’s disease, substance abuse (past or current), or major psychiatric illness • Nondemented based on neurologist diagnosis
MEASURES • Neuropsychological battery • verbal & nonverbal learning and memory, orientation, abstraction, naming, fluency, comprehension, and visuospatial ability • Functional Capacity • Blessed Functional Activities Scale • Schwab & England ADL Scale • African American Acculturation Scale • 33-item self report
Demographics and cognitive test performance (R2) Friday Harbor 2005
Elderly African Americansn = 503 * p < .01
Elderly African Americansn = 503 * p < .01
Deconstructing Race • Cultural experience • Acculturation level • Educational experience • Quality of education
EDUCATION Elementary in South 77% Of high school educated, HS in South 62% Of college educated, college in South 80% Rural elementary 46% Rural high school 15% Mostly Black (>90%) elementary 84% Mostly Black high school 64%
Length of School Term Friday Harbor 2005
Student Teacher Ratio Friday Harbor 2005
Person-specific teacher-student ratio • Alabama, Georgia, North Carolina, and South Carolina • Calculated using date of birth and number of years of school • Average state-level student-teacher ratio for years the respondent was in school • Ranges from a low of 27 to a high of 76 Friday Harbor 2005
Quality of education & reading level • In 1960’s, economists began to relate school characteristics to achievement of students • Coleman report • Achievement was measured with standardized tests of reading, math, and spelling • Reading level is relatively stable across adulthood & early dementia • We could use reading level to estimate quality of school among elders Friday Harbor 2005
English Reading Level Wide Range Achievement Test - reading subtest I V Z J Q see red milk was between cliff stalk grunt clarify residence urge rancid conspiracy deny quarantine deteriorate regime beatify internecine regicidal puerile factitious lucubration epithalamion inefficacious synecdoche