IDBI LTD.
IDBI LTD. Technical Outlook . Short Term Target: 150-190 Medium Term Target: 240-300 We Initiate Buy with a target of 150 on short term view. We could see an Inverted Head and Shoulder formation on weekly Basis. A break out of 155-160 could lead the rally to 190-240 on medium term.

IDBI LTD.
E N D
Presentation Transcript
Technical Outlook Short Term Target: 150-190 Medium Term Target: 240-300 We Initiate Buy with a target of 150 on short term view. We could see an Inverted Head and Shoulder formation on weekly Basis. A break out of 155-160 could lead the rally to 190-240 on medium term. Use stock correction as an opportunity to Accumulate in the range of 125-135 with a target of 240
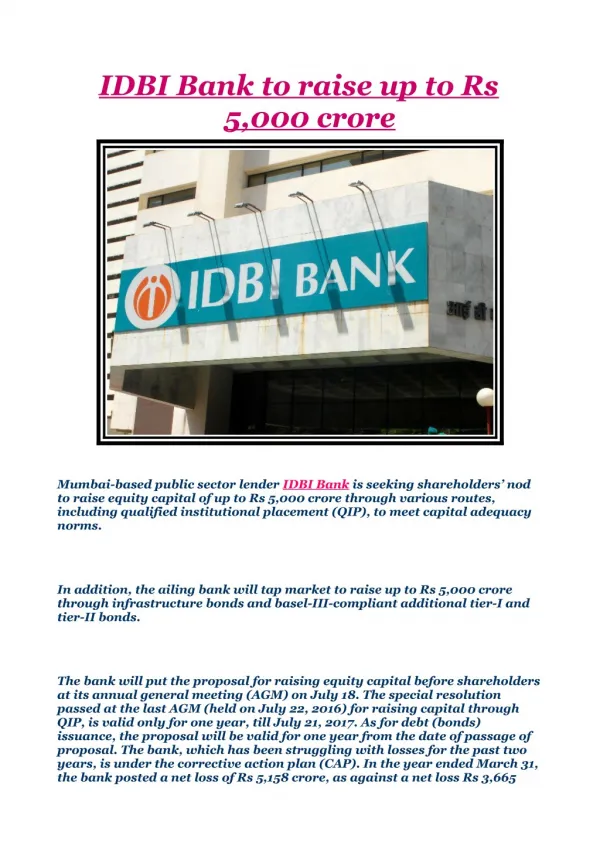
IDBI LTD. Investment rationale IFCI corporate developments an immediate trigger IDBI owns around 5% of IFCI. IFCI is currently under-going a structural change in its existence with a probable infusion of a strategic partner with a global pedigree and Indian aspirations. IDBI also co-owns with IFCI, structural gems of capital markets like SEBI, NSE, SHCIL, CARE, ISIL, OTCEI and NSDL. It also owns sizable holdings in Money Market institutions like DFHIL, STCIL and CCI. Potential of value unlocking from the Investments portfolio Apart from these investments, IDBI owns equity investments in various companies and institutions. The bank has quoted equity investments of Rs 85.1bn (Book Value as on March 2006), with a market value of Rs 85.9bn. We expect the bank, to monetize a sizeable proportion of its quoted and unquoted investments over the next couple of years to restrict this exposure to the regulatory compliance limit by Sept’09. The discounted realizable value of these investments are worth Rs 82.3/ share of IDBI.
IDBI LTD. UWB acquisition benefits to accrue in the long-run IDBI’s acquisition of UWB (in Oct’2006) is expected to be beneficial over the long run for the bank. The acquisition increased IDBI’s network by 230 branches from 195 branches to 425 branches. IDBI can leverage on UWB’s widespread network, access to the Low Cost Deposits and expand its Retail Credit Portfolio. Improved Operational Performance on recoveries & restructured assets IDBI has assets of about Rs130bn under a Stressed Assets Stabilisation Fund (SASF), which were transferred at Rs90bn. The Bank is expected to make recoveries from these SASF accounts, and subsequently redeem the zero-interest bearing securities (means improved NIMs).
IDBI LTD. Plugging The Missing Pegs IDBI is also focusing on increasing its Fee Based Income. It has tied up with Fortis Insurance & Federal Bank to form a Life Insurance company, where the Bank holds major stake i.e. 48%. Further, leveraging on corporate relationships, the Bank is expected to increase its offerings and enter businesses such as Assent Management company. View and Valuation IDBI’s business model is blessed with regulatory forbearance. Its transition to a potential banking monolith has just been initiated. In the near future, its strategic evolution would rest on potential unlocking from investments and operational improvement – something we feel is a compulsive regulatory conclusion. We expect the bank to definitely unlock value from its investments in next couple of years – and expect the stock to get re-rated on the back of concurrent improved operation of the Bank’s core business on an efficient business structure.
IDBI LTD. Core Business – a core focus IDBI has registered decent growth in its core business operations i.e., its business volumes with a thrust on its Deposits portfolio. During the period FY2005-07, aggregate business of the bank grew at a CAGR of 32.2% with deposits growing at a CAGR of 69.4%. In the same period, the bank’s credit portfolio grew at a CAGR of 17.3% thereby beefing up its revenue stream from its core business activity. With an up tick in the Indian credit cycle driven by a burgeoning economy, we expect the bank to leverage its existence corporate relationship to expand its business volumes. Further, with a wider geographic coverage post the acquisition if UWB, the bank is better placed to garner market share from non industrial portfolio also. Going forward, we expect the bank’s advances to grow at a CAGR of 21% to Rs 914bn between FY2007-09E and deposits would grow at 36.6% to Rs 809bn.
IDBI LTD. Q1FY2008 Financial Performance • Net Interest Income declined by around 35% to Rs 629mn on the back of 35% rise in the Interest Expenses. • Non Interest Income grew by around 40% to Rs 4bn driven by sale of Investments to the tune of Rs 2.6bn (NSE stake sale - Rs 2bn and Others (Rs 0.6bn). • Operating Expenses grew by 8.3% on the back of 36% rise in Staff Cost. • Aggregate Provisions more than doubled to Rs 1bn, lead by 194% rise in Other Provisions and 53% increase in Tax Provision. • Net Profit grew by mere 2% to Rs 1.5bn. • The Banks’ Total Business grew by 30% driven by Deposits growth of 61% to Rs 468bn and Advances growth of 14% to Rs 598bn.
Disclaimer: This report has been prepared solely for information purposes and the information contained herein may not be deemed to be an investment advice. Such information is impersonal and not tailored to the investment needs of any specific person. The information contained herein is not a complete analysis of every material fact representing any company, industry or security. The views expressed may change. While the information contained herein has been obtained from sources believed to be reliable, no responsibility (or liability) is accepted for the accuracy of its contents. Investors are advised to satisfy themselves before making any investments and should consult with and rely upon their own advisors whether and how to use such information in making any investment decision. Neither the author nor his firm accepts any liability arising out of use of the above information/ article. This report is exclusively for the clients of Venkataraman & Co. only. VENKATARAMAN & CO., Stock & Share Brokers, New No.2 (Old No.52) Dr. Ranga Road, Mylapore, Chennai 600 004. Web: www.venkataraman .com E-mail: vnkco@vsnl.com