Download
1 / 14
150 likes | 321 Views
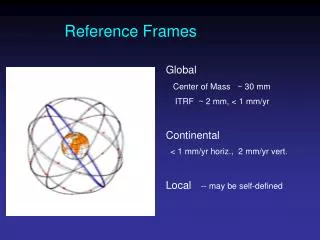
Vertical Reference Frames for Sea Level Monitoring. Thomas Herring Department of Earth, Atmosphere and Planetary Sciences http://www-gpsg.mit.edu/~tah. Overview. Examine scale variations in global reference (system scale directly effects heights) Effects of satellite phase center positions

E N D
Vertical Reference Frames for Sea Level Monitoring Thomas Herring Department of Earth, Atmosphere and Planetary Sciences http://www-gpsg.mit.edu/~tah Fall AGU 2001
Overview • Examine scale variations in global reference (system scale directly effects heights) • Effects of satellite phase center positions • Systematic variations in scale and position Fall AGU 2001
Acknowledgements • Scripps Orbit and Permanent Array Center (SOPAC) for making available re-processed permanent GPS array data. Available as full-covariance, loosely-constrained solutions • Mike Heflin at JPL for reprocessed GIPSY analyses. Time series of results. Fall AGU 2001
Analysis from SOPAC reprocessed GPS data between 1992 and 2001 • GPS phase measurements at L1 and L2 from a global distribution of station used • Analysis here is “un-constrained” • All site positions estimated • Atmospheric delay parameters estimated • “Real” bias parameters for each satellite global, integer values for regional site combinations (<500 km) • Orbital parameters for all satellites estimated (1-day orbits, 2-revolutions) • 6 Integration constants • 3 constant radiation parameters • 6 once-per-revolution radiation parameters Fall AGU 2001
Global GPS analysis • Data used between 1992-2001 • Full analysis has ~600 stations (analysis here restricted to ~100 sites that have more than 5 years of data • Large density of sites (~300) in California • Total data set has > 2 billion phase measurements Fall AGU 2001
Specific sites analyzed • Total of 100 sites analyzed of which 50 were used to realize coordinate system based on ITRF2000 • Since analysis has little constraint, it is: • Free to rotate • Possibly free to translate (explicit estimation) • Possibly free to change scale (explicit estimation) • Latter two effects should not be present but these we will explore here. Fall AGU 2001
Network used in analysis Black: Frame sites; Red other sites Fall AGU 2001
Results from analysis • “Common Mode” errors seen in regional frames • Scale variations: Comparison with ITRF-2000 and recent JPL analysis (Mike Heflin) • Satellite phase center positions effects Fall AGU 2001
Scale estimates Fall AGU 2001
Estimated height rates as function of latitude Fall AGU 2001
Effects of changes in the satellite phase center position As the position of the phase center changes, an elevation angle dependent error is introduced. dh is change in radial component dr = dh cos g ; sin g = (R/a) sin y ; (R/a) = 0.24 Fall AGU 2001
Height changes per unit offset as function of minimum and maximum elevation angles used in data analysis Polar sites will have limited max elevationTypical effect is 0.03 m/m Fall AGU 2001
Summary of effects • GAMIT scale rate -0.24 ppb/yr; JPL scale rate -0.10 ppb/yr • 51-GPS reference sites in ITRF2000 have average height rate of 0.9 mm/yr (0.14 ppb/yr) • Satellite phase center: Block II 1.023 m or 0.953 m? expected scale change 0.35 ppb Fall AGU 2001
Conclusion • Both GAMIT and JPL analyses show negative scale rate. Height rates 1.5-0.6 mm/yr. • Common annual signals in time series are likely to be real (atmospheric/snow loading effect). ITRF may need non-secular components to site positions to be better define the terrestrial system. • Evolution of GPS constellation with time might explain part of the scale change or Average height rates in ITRF2000 may be biased. Fall AGU 2001