Download
1 / 17
170 likes | 378 Views
The Use of Geographic Information Systems (GIS) in IR. AIRPO Alex Bay, New York June 13 th , 2003. Dan Jardine, Research Analyst Binghamton University (SUNY). What Is GIS ?. Geographic Information Systems Making Maps!! Adds Spatial or Visual Component to Data

E N D
The Use of Geographic Information Systems (GIS) in IR AIRPO Alex Bay, New York June 13th, 2003 Dan Jardine, Research Analyst Binghamton University (SUNY)
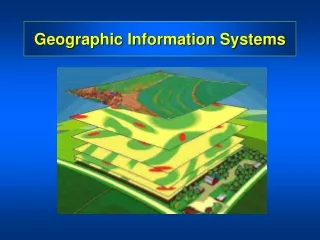
What Is GIS ? • Geographic Information Systems • Making Maps!! • Adds Spatial or Visual Component to Data • Effective Method of Portraying Data • Visual Communication Tool • “Have you ever really seen your data?” • Uncovers Spatial Patterns/Relationships • Key Requirement: A Locational Identifier in Data (e.g. Address, ZIP Code, etc.)
Areas in IR Where GIS Can Be Applied • Enrollment Management • Marketing/Public Relations • Student Affairs • Alumni Donations • Facilities Planning/Management
Examples of IR-Related Data That Can Be Mapped • Student Data Files • Survey Data (e.g. CIRP) • Admissions Data – (Inquiries, Applications, Admits & Enrollees) • High School Data (e.g. EPS) • Alumni Data • Facilities Data • Demographic Data (e.g. U.S. Census Data)
IR Questions GIS Can Help to Address • Where do our (best) students come from? • Where can we find more students like them? • Where should we focus our recruiting resources? • Do attitudes/expectations differ by region? • Where is the most/least utilized space on campus? • Where should we focus our Alumni donations campaign? • Great Planning Tool!!
Number of Students (Fall 1999) 500 to 2,470 (6) 250 to 500 (4) 100 to 250 (9) 50 to 100 (9) 25 to 50 (6) 0 to 25 (28)
Number of Students (Fall 1999) 500 to 2,470 (6) 250 to 500 (4) 100 to 250 (9) 50 to 100 (9) 25 to 50 (6) 0 to 25 (28)
Average SAT Scores by County 1,172 Freshmen, 1998 0 1,110 1,170 1,217 0 0 1,095 0 1,181 1,253 1,230 1,258 1,190 1,130 1,222 1,080 Washington Washington Washington Washington Washington Washington Washington Washington Washington Oneida Oneida Oneida Oneida Oneida Oneida Oneida Oneida Oneida Monroe Monroe Monroe Monroe Monroe Monroe Monroe Monroe Monroe 1,249 1,180 Saratoga Saratoga Saratoga Saratoga Saratoga Saratoga Saratoga Saratoga Saratoga 1,200 Onondaga Onondaga Onondaga Onondaga Onondaga Onondaga Onondaga Onondaga Onondaga 1,340 1,225 1,280 Schenectady Schenectady Schenectady Schenectady Schenectady Schenectady Schenectady Schenectady Schenectady 1,323 1,230 Ontario Ontario Ontario Ontario Ontario Ontario Ontario Ontario Ontario 1,197 Seneca Seneca Seneca Seneca Seneca Seneca Seneca Seneca Seneca Erie Erie Erie Erie Erie Erie Erie Erie Erie 1,210 1,134 0 1,165 Rensselaer Rensselaer Rensselaer Rensselaer Rensselaer Rensselaer Rensselaer Rensselaer Rensselaer Albany Albany Albany Albany Albany Albany Albany Albany Albany 1,245 1,064 0 1,260 1,140 1,237 0 1,177 1,330 1,184 1,228 1,217 Steuben Steuben Steuben Steuben Steuben Steuben Steuben Steuben Steuben 1,189 Chautauqua Chautauqua Chautauqua Chautauqua Chautauqua Chautauqua Chautauqua Chautauqua Chautauqua Broome Broome Broome Broome Broome Broome Broome Broome Broome 1,265 1,233 Ulster Ulster Ulster Ulster Ulster Ulster Ulster Ulster Ulster 1,251 Sullivan Sullivan Sullivan Sullivan Sullivan Sullivan Sullivan Sullivan Sullivan 1,223 1,211 1,226 1,258 Rockland Rockland Rockland Rockland Rockland Rockland Rockland Rockland Rockland 1,148 1,204 1,087 1,226 1,234 1,154 1,201 Average SAT Score 1,300 to 1,350 (3) 1,250 to 1,300 (9) 1,200 to 1,250 (22) 1,150 to 1,200 (12) 1,000 to 1,150 (9) 0 to 0 (7)
Percent BU First Choice 75 to 100 (231) 50 to 75 (145) 33 to 50 (38) 1 to 33 (11) 0 (1173)
Number of 15-19 Yr Olds 1,000 to 9,140 (377) 500 to 1,000 (189) 250 to 500 (238) 100 to 250 (306) 0 to 100 (488)
Number of Students By ZIP Code 26 to 551 (87) 11 to 25 (204) 6 to 10 (128) 3 to 5 (212) 1 to 2 (327) 0 (640)
Median Income 45,000 to 120,000 (268) 35,000 to 45,000 (282) 30,000 to 35,000 (289) 25,000 to 30,000 (389) 5,000 to 25,000 (349)
Getting Started With GIS • New York State has Contract with ESRI, makers of ARCView software • MapInfo can be purchased from SPSS for around $250 • Both come loaded with base maps – U.S., Counties, ZIP Codes • Many Websites offer FREE base maps and data – U.S. Census Bureau • Forthcoming New Directions Volume on GIS in IR this Fall – Many Examples! • http://buoir.binghamton.edu