Download
1 / 37
370 likes | 531 Views
Rails, Coal, Shale & Beyond. AB HATCH abh18@mindspring.com 155 W68th St Suite 1117 NYC 10023 www.abhatchconsulting.co / MillerTabak Rails & Coal – The King is Dead, Long Live the New King Minnesota! July, 2012. Rail Assessment. Strengths. Challenges. Strong secular growth

E N D
Rails, Coal, Shale & Beyond AB HATCH abh18@mindspring.com 155 W68th St Suite 1117 NYC 10023 www.abhatchconsulting.co / MillerTabak Rails & Coal – The King is Dead, Long Live the New King Minnesota! July, 2012
Rail Assessment Strengths Challenges • Strong secular growth • Favorable market structure • Supply constraints • Solid barriers to entry • Limited alternatives • Capital intensity • Capacity bottlenecks • Port congestion • Reliability vs. trucks Opportunities Threats • Pricing • Volume Growth • Service levels / productivity • Modal shift • Consolidation? • Economic malaise • Rising capital requirements • Regulation • Maritime trade flows
Future Growth Potential 5 Secular stories plus…. 1-Intermodal – International and Domestic 2-Grain – the world’s breadbasket 3-Coal? Exports – “legs”? 4-Shale to the rescue? 5-Chemicals The Manifest/Carload “Problem”/MSW (garbage), perishables, others Point-to-point vs. Hub & Spoke (or Southwest vs. United)
Near Term • Q1 – EPS +30% despite: coal, grain, economy- beats Street expectations • Q2 – starts Wed (CSX) – up 20/20? • End of coal decline? But not grain? Where are we in recovery? Pricing? • Cash flow – still “balanced” use?
Current Issues Rails in the Recovery – or in another slowdown? Is 2012 “just another” 2011? What’s true? RR (cyclical) traffic or business headlines? End of the Coal Age? Capex – Strategic or Tactical plans prevail? $13B! PTC After the Rereg Fight what? STB? TSW? Govt role –partner? Or preoccupied &broke? The Green mantle – two-edged sword…. PE &Infrastructure – and activist? – funds: back for good? CP…. New “Golden Age”? Service
What, me worry? • Coal – its price not community • Quick then suddenly – 10% hit? • Activists – what's next? • Compensation: shale (+++)? • Compensation: chemicals? • Compensation: export coal? • Compensation: domestic intermodal?
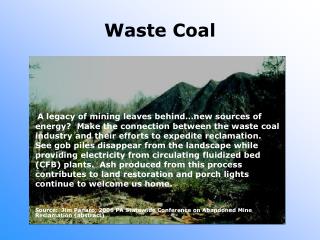
Recent Coal Industry Trends • Extremely mild winter across the U.S., low natural gas prices and accelerating railroad cycle times have caused an sudden glut of existing coal cars • Coal cars in storage are estimated to be at 23,000 cars or 8% of the fleet, compared to 8,000 in December 2011 or 3% of the fleet. Total industry railcars in storage total 283,000, or 18.6% of the fleet. • Winter season heating degree days (a measure of cold temperatures and power demand for heating) are down 18.3% vs. last year and are 13.4% below the 10 year average • Year to date power generation is down 6.2% versus 2011 levels • YTD U.S. coal loadings through first six weeks of 2012 were down 3% versus same period in 2011 • Railroad velocity has increased by 2 mph in January compared to November • Coal exports were strong in 2011, reaching 107 million short tons, up 31% vs. 2010 and reflecting the highest annual total since 1991
Intermodal Issues 2012+ • International: trade flows, retail sales, exports & balance – UNP’s vision vs NRF, TTX • Panama Canal? On time? How much? Etc…. • Emerging Developments – Rupert, Lazaro, Miami • Domestic – development of “Corridors” & “Gateways”, etc • Domestic – bimodal partners, shipper developments • Domestic – service & pricing? • Q1/12 – up 5.9% (domestic +9%, int’l +3%, IMC+11%)! • “There’s somethin’ happening here….”
Coal • Export looks flattish at high levels – sustainable? • CSX vs NSC vision on domestic utility • 52% share in 2000; 45% in 2010; ?? In 2020? • Chesapeake, Patriot (CH 11) try to control supply side
Shale • Frac Sand, brine & water, pipe and aggregates inbound • In cases of Oil, “Rolling Pipelines” out…. • Hess – 286 cars, 9 trainsets now, 27 in a few years • Tar Sands and pipelines • Chemical Industry • Industrial Development
Carbon Footprint– from cocktail chatter to decision point 2003 – 221/F500 report on carbon; 409/F500 in ’09 Green supply chains enforcement by Wal-Mart (from $2B transport spend to $4B+ by ’11); GE, P&G, etc…. Anticipating future EPA regs (12/23/11) and emissions law
Intermodal Growth DriversDomestic and International Globalization Trade Railroad Cost Advantages Fuel prices Carbon footprint Share Recovery From Highway Infrastructure deficit & taxes Truckload Issues; regulatory issues, driver issues
Domestic Intermodal The real growth opportunity is the age-old goal of taking trucks off of the highway Driving down the LOH (requires very tight service standards) Corridor development (see NS’ “Crescent”); truck partnerships (see JBHunt) Fuel price, carbon footprint, infrastructure shortages and congestion, driver shortages (CSA 2010/11/12; HoS) Trailer (TOFC/”Piggyback”) the gateway drug” for containerization Opportunities in unitized carload as well (“intermodal-like”), ex Tropicana, RailEx, etc….
Truck/Rail Intermodal Market Share Truck and Rail Intermodal in Markets 500 Miles and Greater Millions of units Source: Assessment of 2007 Commodity Flow Survey and 2007 Rail Carload Waybill Sample
Modal Shift Projection Current Rail Intermodal Market % of Market Share Projected Market Shift Current Truck Market
Rail Intermediate term volume prospects ABOVE GDP ABOVE GDP • Intermodal – Domestic (++) • Intermodal - International • Agricultural products • Export Coal • Ethanol • Chemicals! GDP-GROWTH • Autos (+?) • Lumber • Aggregates • Metals (+?) UNCERTAIN • Domestic Coal (-?) BELOW GDP • Paper • Auto Parts (?)
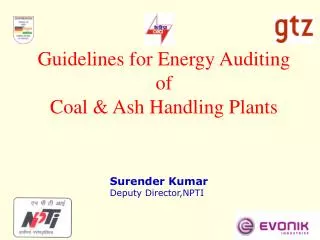
Rail Capex in 2011/12 • Record $12B last year • Record $13B this year – many rails pegging at 17-18% of revenues (rising by double digits) • Corridor developments, NG, terminals, locos, cars, shale buildouts, etc • PPPs – in decline? • Still emerging as DPS plays, buying in shares
Truck/Rail Intermodal Market Share2035 Status Quo Truck and Rail Intermodal in Markets 500 Miles and Greater Millions of units Source: Assessment of 2007 Commodity Flow Survey and 2007 Rail Carload Waybill Sample
Truck/Rail Intermodal Market Share2035 50% Market Share Truck and Rail Intermodal in Markets 500 Miles and Greater Millions of units One example of the dramatic benefits of shifting to rail intermodal is illustrated by the fact that just one long-distance, double-stack train between Chicago and Los Angeles can save 75,000 gallons of fuel by replacing 300 trucks, each traveling 1,983 miles. Source: Comparative Evaluation of Rail and Truck Fuel Efficiency on Competitive Corridors, ICF International, published by the Federal Railroad Administration (2009) Source: Assessment of 2007 Commodity Flow Survey and 2007 Rail Carload Waybill Sample
CS: Future Corridor Volumes Compared to Current Corridor Capacity (Cambridge/AAR) - 2007 Below capacity Near capacity At capacity Above capacity 2035 without improvements
Railway Innovation CP – larger trains CN – alliances, routing protocols – the scheduled railroad! BNSF – grain “Shuttles”; JBHT&Domestic Intermodal, Logistics Parks NS – PPPs, JVs and “Corridors” KCS – little engine that can – Mexico, Lazaro, Houston… CSX – MSW, RailEx, Trop Train, etc…. UP- Doublestacks, exploiting the carload franchise; the PRB All: Short line cooperation, Operating Plans, communications/IT/PTC, Disintermediation, operating excellence….
Growth is Expensive Huge Capex - $50B in the last 5 years in the US – through the Great Recession! AND: Comeback of the share repo/DPS? EPS beat the Street consistently, yet: Uneven returns in the Modern Age Recent improving trend line Misunderstanding Intermodal profitability 2004-8 Threats to ROIC threaten capacity Street begins to call for capex reduction? Suppliers 2012 looks solid – can they hold on till true recovery?
Railroad Capital ExpendituresClass I Railroads Billions Source: Railroad Facts & Analysis of Class I Railroads, AAR
RR CoC vs. ROIC – RR Stocks have done well but… they still trade at a discount to all stocks Source: Surface Transportation Board Note: Cost of equity estimation method changed by Board effective 2006 and 2008.
Railroad Rates- the old story Class I Railroads, Revenue Per Ton-Mile – another (related) New Paradigm Cents Constant $: Down 51% since 1981 Current $: Up 5% since 1981 Source: Railroad Facts, AAR
Service will be the Key to the Next Cycle Service at all time highs $40B spend in last 5 years (service ought to be better!) Putting increased traffic back on at current velocity means: Higher asset utilization, more market share gains, greater operating leverage (perfect circle affects all stakeholders) Implications for equipment fleets
CP • OY. 2nd (3rd) Proxy Fight since 1954 • Not a takeover • HH track record vs recent CP (OR, weather, M&A, growth) • HH goal 65% OR by 2015 • CP goal 70-72% in three years (YE’11 83.1%; C1 avg 71%) • (as example) CSX goal 65% OR 2015 • CP’s new management team yet to be revealed….
Positive Train Control (PTC) “Unfunded Mandate” – part of 2008 safety bill Overseer is FRA – who puts cost/benefit ratio at 22:1 Rails have put cost of installation and maintenance at $10B – and rising (UP, CSX have increased 2011 capex based in PTC) Possible benefits in capacity, velocity, fuel consumption as well as safety; many of those captured by other technological advances Covers all rail interaction with passengers and TIH as of 2008; short lines exempted Technology proven only in limited scope (BN/Wabtec: ”ETMS”) Initiated after Chatsworth accident – obvious public benefits Contrarian viewpoints exist – the new “Digital Railway” Efforts to reduce footprint, extend deadline….
New Transport Bill • Rumor! Tue – too little/too late (or “calamity averted barely and not for long”) • Tiger 3 20% RR decline ($104mm) • PTC deadline to be extended from 2015 to 2020? Not yet…. • No TSW change • No Freight Plan • Govt’s declining role (in infrastructure!)
Warren’s $44B “all-in” bet Advantages of going private? (capex cycle) – will we see now? Influence in DC - “Robber Baron” vs. “Sage” Bets not (just) on economy – rereg, coal, western intermodal Bought on the cheap! – How does the investment look today, folks?
The Staggers Act: An American Success Story (Index 1981 = 100) Productivity Volume Staggers Act Passed Oct. 1980 Revenue Price Source: AAR
Simple Math Rates Returns Capital Expenditures Capacity Service ARE ALL CONNECTED! Virtuous Circle (’03-07) or Disinvestment?
www.abhatchconsulting.com ABH Consulting/www.abhatchconsulting.com Anthony B. Hatch 155 W. 68th Street New York, NY 10023 (212) 595-0457 ABH18@mindspring.com www.railtrends.com