Download

1 / 25
260 likes | 379 Views
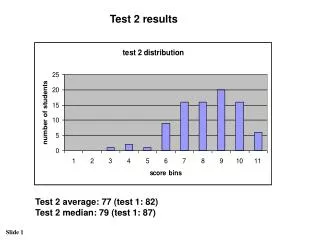
Analysis of Test Results. What we’ll have to do:. Load-Deflection curve. Load Vs Strain curve for steel and concrete Find yield load ( e s = 0.002) for flexural rebar and strain at failure load for concrete and rebar. First yield load for flexural reinforcement. Ductility of the slab.

E N D
What we’ll have to do: • Load-Deflection curve. • Load Vs Strain curve for steel and concrete • Find yield load (es = 0.002) for flexural rebar and strain at failure load for concrete and rebar. • First yield load for flexural reinforcement. • Ductility of the slab. • Energy absorption. • Deflection profile.
Calculate flexural strength and Punching shear capacity of the slab. • Compare test result with predicted result. • Show a photograph depicting the crack pattern at failure. • Make comment on the mode of failure of the slab.
T5 T2 T4 T1 1900 T3 Tension Reinforcement and Strain gauges arrangement 1900 T1(1050,845);T2(1260,1020);T3(1460,845);T4(1590,1020);T5(810,1080)
C7 C6 C8 C9 Compression Reinforcement and Strain gauges arrangement C6(820,770); C7(1090,820); C8(820,580); C9(820,400)
5 3 1 2 4 30, 70, 100, 100 Concrete Strain gauge locations
100 KN 150 KN 200 KN Steel Strain Distribution
50 KN 100 KN 150 KN 200 KN Concrete Strain Distribution
Find yield load (es = 0.002) for flexural rebar and strain at failure load for concrete and rebar. • First yield load for flexural reinforcement.
Ductility and Energy Absorption of the Slab Ductility = Ratio of the deflection at 25% of maximum load (after reaching the maximum load) to the deflection at the first yielding of flexural reinforcement. Energy Absorption = Area under the load deflection curve up to 25 % maximum load (after reaching the maximum load)
Deflection Profile 1 division = 0.01 mm 1 cycle = 1 mm
Show a photograph depicting the crack pattern at failure and Make comment on the mode of failure of the slab If 1 , Flexural failure If 1 , Punching Shear failure From crack pattern Make comment on mode of failure