Download
1 / 1
10 likes | 193 Views
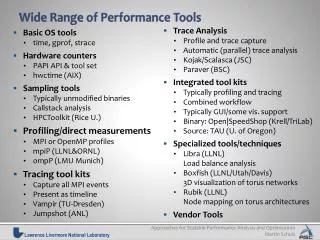
Wide Range of Performance Tools. Basic OS tools time, gprof , strace Hardware counters PAPI API & tool set hwctime (AIX) Sampling tools Typically unmodified binaries Callstack analysis HPCToolkit (Rice U.) Profiling/direct measurements MPI or OpenMP profiles mpiP (LLNL&ORNL)

E N D
Wide Range of Performance Tools • Basic OS tools • time, gprof, strace • Hardware counters • PAPI API & tool set • hwctime (AIX) • Sampling tools • Typically unmodified binaries • Callstack analysis • HPCToolkit (Rice U.) • Profiling/direct measurements • MPI or OpenMP profiles • mpiP (LLNL&ORNL) • ompP (LMU Munich) • Tracing tool kits • Capture all MPI events • Present as timeline • Vampir (TU-Dresden) • Jumpshot (ANL) • Trace Analysis • Profile and trace capture • Automatic (parallel) trace analysis • Kojak/Scalasca (JSC) • Paraver (BSC) • Integrated tool kits • Typically profiling and tracing • Combined workflow • Typically GUI/some vis. support • Binary: Open|SpeedShop (Krell/TriLab) • Source: TAU (U. of Oregon) • Specialized tools/techniques • Libra (LLNL)Load balance analysis • Boxfish (LLNL/Utah/Davis)3D visualization of torus networks • Rubik (LLNL)Node mapping on torus architectures • Vendor Tools