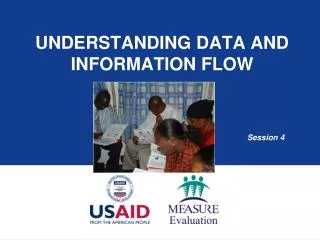
Session 6: Data Flow, Data Management, and Data Quality
Session 6: Data Flow, Data Management, and Data Quality. Session Overview. Surveillance Project Example Data Management: Six Essential Steps Small-Group Exercise: Data Flow and Use Table. Session Objectives. By the end of the session, the participant will be able to:

Session 6: Data Flow, Data Management, and Data Quality
E N D
Presentation Transcript
Session Overview Surveillance Project Example Data Management: Six Essential Steps Small-Group Exercise: Data Flow and Use Table
Session Objectives By the end of the session, the participant will be able to: • understand what a data management system is and how it can help with data quality assurance; and • identify ways to ensure data quality at each step of a data management system.
Surveillance Project: Objectives Grant: To strengthen animal and human health surveillance for novel influenza viruses Year 1 program objectives for the grant are: • Objective 1: Strengthen case-based reporting for influenza-like illness in humans. • Objective 2: Establish market-based active surveillance of poultry.
Surveillance Project: Selecting Indicators Objective 1: Strengthen case-based reporting for influenza-like illness in humans: • Capacity building – Number of hospitals with at least two clinicians trained in case reporting for influenza-like illness in humans. • Case-based reporting – Number of patients diagnosed with ILI for which a complete set of case-based data has been recorded. Objective 2: Establish market-based active surveillance of poultry: • Animal health surveillance – Number of targeted markets in which samples were collected as part of an active surveillance plan within the past six months.
Surveillance Project: Capacity Building Indicator — Number of hospitals with at least two clinicians trained in case reporting for influenza-like illness in humans. How are these data collected? • Clinicians selected for training – how? • Training records • How are data aggregated at the training organization level? • How are data forwarded to next levels (national, international)?
Surveillance Project: ILI Case-Based Reporting Indicator — Number of patients diagnosed with ILI for which a complete set of case-based data has been recorded. • A person diagnosed with ILI – how? • Clinician completes case reports. • How are data recorded in facility records? • How are data aggregated at all levels (facility, district, national, international)?
Surveillance Project: Market active surveillance Indicator — Number of targeted markets in which samples were collected as part of an active surveillance plan within the past six months. • A market is targeted as part of an active surveillance plan — how? • Samples are collected by surveillance team. What data are collected? • Samples sent to laboratory along with associated data. Lab conducts testing. • How are data aggregated at next level (e.g., from surveillance team or laboratory)? How are data aggregated at the national and international level?
Six Key Steps SOURCE COLLECTION COLLATION ANALYSIS REPORTING USE
Sources Definition: Data/facts may originate from primary, secondary, or tertiary data sources. Examples include: • Primary sources — Training sign-in sheets, talking to training participants. • Secondary — District spreadsheets that list hospitals with trained clinicians. • Tertiary — National census data. Data can be routine or non-routine.
Collection Definition: The process of gathering data that are generated from various activities implemented by an organization and are relevant to an organization’s M&E framework. This involves obtaining data from original sources and using tools (paper or electronic) to collate, analyze, and report the data. Data can be collected using: • questionnaires • interviews • observations • existing records
Collation Definition: To combine data into summarized (often standardized) formats. This can be done: • electronically or manually; and • at a different levels (district, national). Example: Monthly surveillance summary sheets in all of the districts are sent to the national ministry of health/agriculture where they are combined to get the total at the national level.
Analysis Definition: Analysis is the review and manipulation of data. Depending on the type of data and the purpose, this might include: • application of statistical methods • selecting or discarding certain subsets based on specific criteria • other techniques Analysis enables data users to understand or interpret the results.
Reporting Definition: To describe and present crude data and processed data as useful knowledge is reporting. It is the process that provides program implementers and stakeholders an opportunity to inform themselves of progress, problems, difficulties encountered, successes, and lessons learned during implementation. Reporting can take many forms, such as: • narratives • graphics
Use Definition: Applying information to make timely and appropriate decisions. • Different users require different types of information to serve various purposes. • Determining factor of the usefulness of the collection of the various data.
Exercise: Data Flow and Use Table In your groups: Using your M&E plan project, map the flow of your data from collection to use. Differentiate between data elements and indicators (transformed data): • source • collection • collation • analysis • reporting • use
Data Quality Issues: Source Poor recording of the data: Incomplete information, illegible notes, etc. Examples: • Data could be incomplete (e.g., incomplete physician notes). • Inconsistent recording of information by different staff. • Data are not available or feasible to collect. Important to consider data quality issues with secondary and tertiary data sources.
Ensuring Data Quality: Source Design instruments carefully and correctly. Include data providers and data processors in decisions to establish what is feasible to collect, review, and process, and how to draft instruments. Develop detailed instructions for data collection process. Ensure all personnel are trained in their assigned task.
Data Quality Issues: Collection Different instruments used to collect the same data. Data entered incorrectly or in wrong fields in a database. Inconsistent entries of data by different data capturers.
Ensuring Data Quality: Collection Develop specific instructions for data collection and routinely check to see if they are followed. Identify procedures for making changes (if necessary) to the data collection process as well as for reporting problems during data collection. Develop standard operating procedures for the collection and management of data as well as for revising collection tools and reporting problems. Check to see if people follow implemented changes to the process by conducting on-site reviews.
Data Quality Issues: Collation Collation issues include: • data inconsistently collated • data entry errors or other errors associated with manual collation • formulae errors • problematic sampling or estimations • no verification or other quality control mechanisms • data not kept secure
Ensuring Data Quality: Collation Develop checklists and approval procedures for key steps. Conduct reviews during entry process. Create an electronic or manual collation tool that includes a data review process by a second individual who is not entering the data. Randomly sample data and verify. Ensure problems are reported and documented, corrected and communicated, and tracked back to the source.
Data Quality Issues: Analysis Data quality issues during analysis include: • incorrect analysis • inconsistent analysis • misrepresentation of results
Ensuring Data Quality: Analysis Ensuring quality during analysis includes: • making sure analysis techniques meet the requirements for proper use; • disclosing all conditions/assumptions affecting interpretations for data; and • having experts review reports to ensure the analysis is reasonable.
Data Quality Issues: Reporting Data quality issues during reporting include: • too little reporting or feedback; • not presenting information in an accessible manner; • misrepresentation of results.
Ensuring Data Quality: Reporting Maintain integrity in reporting – don’t leave out any key information. Synthesize results for the appropriate audience. Have multiple reviewers within the organization. Protect confidentiality in reports and communication tools. Review data and provide feedback to those who have a stake in the results.
Data Quality Issues: Use Quality issues during use may involve: • not having complete data for programmatic decisions; and • not using data to inform programmatic decisions.
Ensuring Data Quality: Use Make timely, data-driven decisions for your program.
Exercise: Data Flow, Data Management, and Data Quality In your groups: Looking back at your data flow and use table, identify potential data quality issues for each of the six steps and what management steps you would take to address them.