Download

1 / 73
730 likes | 753 Views
In a tropical ocean far away, a hurricane churned up large waves that traveled tirelessly towards Nova Scotia. Unaware of the approaching doom, the innocent people of Nova Scotia faced a unique threat with Hurricane Felix. This is the story of how forecasters missed the danger, and the impact of large waves hitting the shores. Learn about the factors affecting wave dispersion, angular spreading, and how these elements played a role in the intensity of Hurricane Felix. Discover the importance of predicting and understanding wave behavior to prepare for future events like this.

E N D
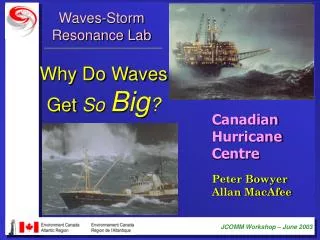
Peter Bowyer Canadian Hurricane Centre
A LONG TIME AGO, • IN A TROPICAL OCEAN FAR AWAY, • A HURRICANECHURNED UP THEWATER.
...DECAYING QUIETLY AS THEY ROLLED TOWARDS THE TINY BIT OF LANDCALLED...
THE INNOCENT PEOPLE OF THIS LAND WERE UNAWARE OF THE APPROACHING DOOM,
HURRICANE FELIX 30N To Halifax 1300 n.miles or 2405 km DIRECTION OF LARGEST WAVES AUG 12, 1995 8:15 am EDT 25N VISUAL IMAGE AT MAXIMUM INTENSITY 60W 65W 55W 20N
Aug.13, 1995 Hurricane Felix is on the map... but poses little threat to Nova Scotia... ...right?
30N 25N 65W 60W DIRECTION OF LARGEST WAVES HURRICANE FELIX To Halifax 1050 n.miles or 1942 km AUG 13, 1995 8:15 am EDT VISUAL IMAGE OF EYE FILLING-IN
Aug.15, 1995 Two days later...Felix should still be no problem for Nova Scotians... ...right?
BUT WHY WERE THESE WAVES SO LARGEWHEN THEY REACHED US? Other hurricanes have been this close before without consequence. What was so special about Felix?
SWELL DECAY Two important factors dominate: Dispersion Angular Spreading Individual wave dissipation can be ignored since it is small in comparison to these other two effects. This includes winds that oppose swell.
Waves are turned on for 12 hours, and then turned off. 36 hours after the waves were first turned on the respective fields of each period look like those at right. Fetch Area 20 seconds Fetch Area 15 seconds Fetch Area 12 seconds Fetch Area 10 seconds Fetch Area 6 seconds WAVE DISPERSION
ANGULAR SPREADING However, waves don’t remain coherent in the direction that they were generated. They fan out. At some point P downstream, there are a variety of directions from which waves may approach.
COMBINED EFFECT OF ANGULAR SPREADING & DISPERSION Here are the two effects combined in one diagram. This is still a crude model.
COMBINED EFFECT OF ANGULAR SPREADING & DISPERSION Here is what the combined effect looks like on a spectrum. The shows the remaining energy.
Co-cumulative Spectra
ENERGY LOSS FROM DISPERSION Missing energy
DISTORTED CO- CUMULATIVE CURVES FOR WIND SPEEDS 36-56 KNOTS The 50-kt wind spectrum is sampled here for 17 to 24 second waves 680 380 24 17
DISPERSION By calculating the range of periods that will be arriving at various time intervals, we can calculate the fraction of original energy also present during each time interval.
DISPERSION Once we know the available energy at different time intervals, we can calculate the wave heights that should be possible at those same times, since HSIG 2a Wave Energy
ANGULAR SPREADING By determining the appropriate fetch width in the generation area as well as the off-line angle of the approaching waves, the energy-loss due to angular spreading can be calculated.
ANGULAR SPREADING Similarly, as with the calculations for dispersion, the resultant values from the nomogram give energy values. But..... HSIG 2a Wave Energy
LOOKING A LITTLE CLOSER FELIX
During its time of greatest intensity, FELIX travelled almost directly towards NS, for a period of 27 hours (121800-132100). It’s closest point during this time was 900 nm.
First we need to determine what the conditions were in the generation region…… ……..near Hurricane FELIX
FELIX was a large hurricane that traveled almost 240 miles N to NNW for a period of 27 hours. Running the CHC trapped-fetch wave Model generated an average HSIG of 13.5 m with an average TSIG of 14.1 sec during this period.
200 mile fetch width 900 mile decay distance at an angle of 15 degrees ANGULAR SPREADING EFFECTThe Key factor in Felix was its size –the width of storm force winds was 200 nm 12%
ANGULAR SPREADING EFFECT SUMMARY Convert the energy to a wave height by taking the square root: Angular spreading multiplier = (.12)1/2 = .35 So, waves from the angular spreading effect alone have been reduced to (13.5 m)(.35) = 4.7 m
DISPERSION EFFECT In the generation region, HSIG = 13.5m and TSIG = 14.1 sec The first task is to determine when the first and last waves will reach Nova Scotia. Then we determine the range of periods present at various intervals during this time.
DISPERSION EFFECT Statistically, the peak, max, and min. periods can be related to the sig. spectral periods: TMAX= 1.64 TSIG= 1.64 (14.1) = ? TPEAK= 1.14 TSIG = (1.14) (14.0) = ? TMIN = .57 TSIG= .57 (14.0) = ?
DISPERSION EFFECT Statistically, the peak, max, and min. periods can be related to the sig. spectral periods: TMAX= 1.64 TSIG= 1.64 (14.1) = 23.1 sec. TPEAK= 1.14 TSIG = (1.14) (14.0) = 16.1 sec. TMIN = .57 TSIG= .57 (14.0) = 8.0 sec. Recall also that waves travel at the group speed according to the formula: Cg = 1.5 T
DISPERSION EFFECT Fastest waves leaving at T0 travel at 1.5(23.0) = 34.5 kts ...covering 900 n.miles in (900/34.5) = ?? hours. Slowest waves leaving the fetch area travel at 1.5(8.0) = 12.0 kts ...covering 900 n.miles in (900/12.0) = ?? hours. Once the shortest period waves arrive, they will last for 27 hours…or until ??? hours after T0
DISPERSION EFFECT Fastest waves leaving at T0 travel at 1.5(23.0) = 34.5 kts ...covering 900 n.miles in (900/34.5) = 26 hours. Slowest waves leaving the fetch area travel at 1.5(8.0) = 12.0 kts ...covering 900 n.miles in (900/12.0) = 75 hours. Once the shortest period waves arrive, they will last for 27 hours…or until 102 hours after T0