Construction Spending & Labor Outlook 2017
Understand the latest trends in construction spending and employment from 2006 to 2017. Explore forecasts for private, public, residential, and nonresidential sectors. Learn about key factors impacting the industry, including infrastructure needs, immigration effects, material costs, regulatory changes, and more. Get insights on nonresidential segments and industrial construction spending patterns. Discover developments in education and healthcare construction, renewable energy projects, and developer-financed ventures. Stay informed on the challenges and opportunities shaping the construction sector.

Construction Spending & Labor Outlook 2017
E N D
Presentation Transcript
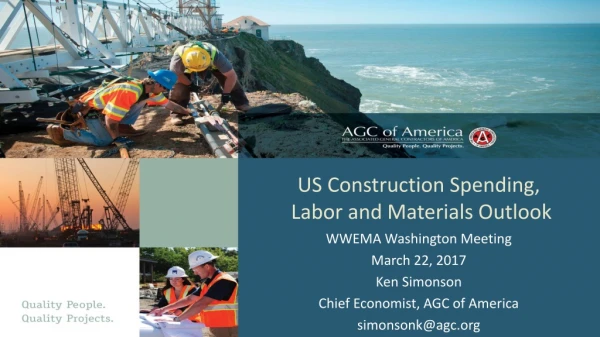
US Construction Spending, Labor and Materials Outlook WWEMA Washington Meeting March 22, 2017 Ken Simonson Chief Economist, AGC of America simonsonk@agc.org
Construction spending & employment, 2006-2017 Total spending, Feb. ‘06 (peak)-Jan. ‘17 billion $, seasonally adjusted annual rate (SAAR) Total employment, Apr. ’06 (peak)-Jan. ‘17 thousands, seasonally adjusted $1.18 trillion (2% below peak) 7.7 million $1.21 trillion 6.7 million Total Total (13% below peak) Private Residential Nonresidential (9% below peak) Residential (19% below peak) Private nonresidential Public January 2016-January 2017: total 1.5% residential 4%, nonresidential 0% January 2016-January 2017: total 3% private res. 6%, private nonres. 9%, public -9% Source: Spending--U.S. Census Bureau; Employment--Bureau of Labor Statistics
Infrastructure: How much? How soon? What types? Funding source? Immigration: Impact on new & current workers? Wall construction? Trade: Higher materials costs? Shortages? Less or more factory const.? Regulatory relief: Which ones? How soon? Health care rewrite: Timing? Impact on demand for hospital const.? Fiscal: Lower taxes? For whom? Bigger deficits? Implications for construction demand, labor supply? Monetary: Higher interest rates? Impact on housing, state/local bonds? Policy possibilities & uncertainties affecting construction Source: Author
Nonresidential segments: 2014-16 change, 2017 forecast Source: U.S. Census Bureau construction spending report; Author’s forecast
Construction spending: public worksannual total, 2008-13; monthly, SAAR, 1/14-1/17; billion $ Highways (99.7% public in 2016) Sewage/waste (99% public) Jan. '16-Jan. '17 change: -10% Jan. '16-Jan. '17 change: -28% Transportation facilities (71% public) Water supply (99% public) public private Jan. '16-Jan. '17 change: -12% (private -11%; public -12%) Jan. '16-Jan. '17 change: -11% • Source: U.S. Census Bureau construction spending report
Key points: roads, transportation, sewer/water • Highway funds benefit from more travel, hence fuel purchases; gradual pick-up in state funding & P3s; higher federal funding unlikely before ‘18 • Railroads slashing investment; pickup in airport projects but no increase likely in port, transit construction funding • Eastern & Midwestern cities under orders to make long-term upgrades to sewer systems that should keep a floor on spending; water utilities hurt by drought, conservation but may get money for lead abatement Source: Author
Construction spending: industrial, heavyannual total, 2008-13; monthly, SAAR, 1/14-1/17; billion $ Power (93% private in 2016) Manufacturing (99% private) Electric Other Chemical Oil & Gas Jan. '16-Jan. '17 change:2% (oil & gas -17%; electric 8%) Jan. '16-Jan. '17 change:-7% (chemical 4%; other -16%) Amusement & recreation (55% private) Communication (99.6% private) Public Private Jan. '16-Jan. '17 change:-2% Jan. '16-Jan. '17 change: 10% (private 18%; public 1%) • Source: U.S. Census Bureau construction spending report
Solar, wind power are growing again; expect more gas-fired plants, natural gas pipelines into ‘18 Mfg decline led by completion or delay of chemical plants (fertilizer, ethane crackers, petrochemicals, LNG) and transportation equipment (cars, trucks, jets, railcars); recovery in ‘18 depends on policy impacts Amusement & recreation spending is very “lumpy”—a few big stadiums at irregular intervals; but funding for local, state, federal parks keeps eroding Key points: power, manufacturing, recreation Source: Author
Construction spending: education, health careannual total, 2008-13; monthly, SAAR, 1/14-1/17; billion $ Education:state/local K-12, S/L higher; private Health care: (private hospital, S/L hospital, other) Total (77% public) Total (80% private) Private hospital S/L preK-12 Other S/L higher ed Private S/L hospital Jan. '16-Jan. '17 change:5% (state/local preK-12 9%; state/local higher ed -9%; private 16%) Jan. '16-Jan. '17 change: 7% (private hospital 9%; S/L hospital -20%; other: special care, med. office, federal 5%) • Source: U.S. Census Bureau construction spending report
Bond issues passed in 2014-16 should boost preK-12 projects in 2017 and 2018 Higher-ed enrollment declined 21% from 2011 to 2016, so colleges need fewer dorms & classrooms; apts. (multifamily) replacing dorms (educational construction) Hospitals face uncertainty about utilization and reimbursement rates if Affordable Care Act is repealed/modified/replaced; also, more competition from standalone urgent care, outpatient surgery, clinics in stores Key points: education & health care Source: Author
Construction spending: developer-financedannual total, 2008-13; monthly, SAAR, 1/14-1/17; billion $ Retail (private) Office (89% private in 2016) Total Private Public Jan. '16-Jan. '17 change: 7% Jan. '16-Jan. '17 change: 29% (private 34%; public -5%) Warehouse (private) Lodging (private) Jan. '16-Jan. '17 change: 23% Jan. '16-Jan. '17 change: 25% • Source: U.S. Census Bureau construction spending report
Retail now tied to mixed-use buildings & renovations, not standalone stores or shopping centers Warehouse market still benefiting from e-commerce; more local than huge regional distribution centers likely in future Record employment each month but office space per employee keeps shrinking; more urban & renovation work than suburban office parks Hotel construction likely to drop as revenue per available room slows Data centers remain a strong niche but no daaavailable on how strong Key points: retail, warehouse, office, hotel, data centers Source: Author
Private residential spending: MF continues to outpace SF seasonally adjusted annual rate (SAAR): Jan. 2011 ($238 B)-Jan. 2017 ($476 B) Multifamily (MF) (Jan. ‘17: $64 B) Single-family (SF) (Jan. ‘17: $254 B) Improvements (Jan. ‘17: $159 B) 12-month % change: Jan. 2011 (-5.3%)-Jan. 2017 (3.7%) Improvements: 10.8% Multifamily: 9.0% Total: 5.9% Single-family: 2.3% Source: U.S. Census Bureau construction spending reports
Private residential spending--2016: 5%; 2017 forecast: 5-10% • SF: 4% in 2016, 6-11% in 2017; ongoing job gains add to demand; but student debt and other credit impairments, limited supply will limit growth • MF: 16% in 2016, 5-10% in 2017; growth slowing but should last till 2018 • occupancy rates, rents have leveled off or dipped in some markets • millennials are staying longer in cities, denser suburbs where MF construction is bigger share of market than in outer suburbs • nearly all MF construction is rental, not condo • Improvements: 4% in 2016, 0-10% in 2017; Census data is not reliable and shows only a loose relationship to SF spending Source: Author
Population change by state, July 2015-July 2016 (U.S.: 0.70%) decrease 0-0.49% 0.5-0.99% 1.0-1.49% 1.5%+ 1.8% 1.8% 1.0% 0.2 % NH0.4% 0.7% 0.1% 1.7% 0.1% 0.2% -0.01% VT -0.2% 0.9% -0.2% 0.7% 2.0% -0.1% 0.4% MA0.4% 2.0% 0.7% 0.1% -0.3% 0.3% 1.7% -0.5% 0.3% 0.5% CT-0.2% RI0.1% 0.02% 0.3% 1.7% 1.1% DE0.8% NJ0.2% 0.03% 0.9% 0.4% 1.6% 0.3% 1.4% 1.1% 0.2% -0.02% MD 0.4% DC 1.6% 0.3% 1.8% AK 0.6% HI0.2% • Source: U.S. Census Bureau
State construction employment change (U.S.: 2.6%) 1/16 to 1/17: 39 states up, 11 + DC down Over -10% -5.1% to -10% -0.1% to -5% 0% 0.1% to 5% 5.1% to 10% Over 10% 7% 11% 5% 4% NH6% 3% 5% 12% 6% 3% 1% VT 2% 4% -5% 2% 10% 3% 1% MA4% -0.4% 5% 2% -1% 3% 2% -2% 1% 3% CT-2% RI9% -1% 3% 3% 4% DE1% NJ1% -1% 4% 4% 2% -0.2% 8% 4% 1% -5% MD 2% DC -8% 7% Shading based on unrounded numbers 8% -10% HI0% • Source: BLS state and regional employment report
Metro construction employment change 1/16 to 1/17: 219 metros up (61%), 35 unchanged, 104 down (29%)
Hardest positions to fill • Source: AGC Member Survey, August 2016
Construction workforce indicators (not seasonally adjusted) Job openings, Jan. 2001-Jan. 2017 Construction hires, Jan. 2001-Jan. 2017 Avg. hourly earnings, 12-month % change, Jan. 2001- Jan. 2017 Unemployment, Jan. 2001-Jan. 2017 Source: Bureau of Labor Statistics
Producer price indexes for key inputs, 1/11-2/17 (Jan. 2011=100) Steel pipe and tube Diesel fuel Latest 1-mo. change: 1.6%, 12-mo.: 8% Latest 1-mo. change: 1.6%, 12-mo.: 44% Copper & brass mill shapes Aluminum mill shapes Latest 1-mo. change: 6.5%, 12-mo.: 25% Latest 1-mo. change: 2.6%, 12-mo.: 8%
Producer price indexes for key inputs, 1/11-2/17 (Jan. 2011=100) Paving mixtures Gypsum products Latest 1-mo. change: 5.3%, 12-mo.: 8% Latest 1-mo. change: -2.1%, 12-mo.: -2% Flat glass Concrete pipe Latest 1-mo. change: -0.3%, 12-mo.: 2% Latest 1-mo. change: 0.0%, 12-mo.: 2% Source: Bureau of Labor Statistics
2015-16 summary, 2017 forecast Source: actuals: Census, BLS; forecasts: Author’s estimates
AGC economic resources(email simonsonk@agc.org) • The Data DIGest: weekly 1-page email (subscribe at http://store.agc.org) • monthly press releases: spending; PPI; national, state, metro employment • yearly employment & outlook surveys, state and metro data, fact sheets: www.agc.org/learn/construction-data