Analysis of Survey Distribution and Returns in Ontario: 1997-2005
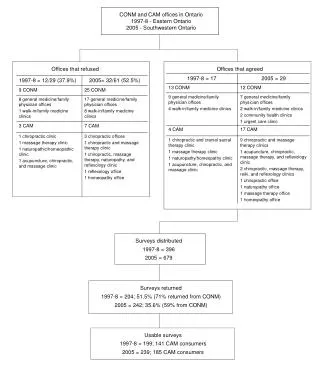
This report examines the distribution and return rates of surveys conducted in Ontario between 1997-1998 and 2005. In 1997-98, a total of 396 surveys were distributed, with a 51.5% return rate yielding 199 usable surveys. In 2005, 679 surveys were distributed, resulting in a 35.6% return rate with 239 usable surveys. This analysis highlights the differences in response rates and participation from various regions, including Central Ontario and Southwestern Ontario, as well as the impact of offices that either refused or agreed to participate.

Analysis of Survey Distribution and Returns in Ontario: 1997-2005
E N D
Presentation Transcript
Surveys distributed 1997-8 = 396 2005 = 679 Surveys returned 1997-8 = 204; 51.5% (71% returned from CONM) 2005 = 242; 35.6% (59% from CONM) Usable surveys 1997-8 = 199; 141 CAM consumers 2005 = 239; 185 CAM consumers CONM and CAM offices in Ontario 1997-8 - Eastern Ontario 2005 - Southwestern Ontario Offices that refused Offices that agreed