Download
1 / 14
140 likes | 159 Views
Learn how to build a remote sensing satellite to analyze Earth's systems by converting radiation into electrical signals. Discover ways meteorologists use data to study weather systems and create false-color images. Explore links between LED technology and energy transformation.

E N D
Transform electromagnetic radiation into an electrical signal that can be used to analyze Earth’s Systems. Build a Remote Sensing Satellite
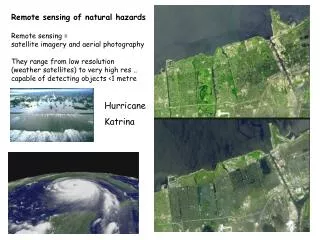
Remote sensing satellites can detect the reflection of the radio waves from precipitation. Meteorologists use that information to analyze weather systems. http://science.nasa.gov/headlines/y2007/02mar_rainandsnow.htm
Different colors can be used to represent frequencies and intensities of electromagnetic radiation that the human eye can not “see”. http://rst.gsfc.nasa.gov/Intro/Part2_2a.html Note: The wavelengths of visible light should range from 400 to 700 nm.
Data indicating different amounts of reflected radio waves can be used to generate a “false color image” of rates and types of precipitation. http://www.google.com/webhp?hl=en
Satellites can detect a wide range of reflected or emitted frequencies of electromagnetic radiation. http://rst.gsfc.nasa.gov/Intro/Part2_1.html
This is a map of snow cover on February 1st, 2010.How is data for maps of such a large area obtained? http://www.nohrsc.noaa.gov/nh_snowcover/
A false color infrared map shows the Arctic with minimum snow and clouds during a period of maximum “green up”. Red areas represent greater amounts of green vegetation. Blue and gray areas represent sparse vegetation. Black areas represent fresh water and white areas represent ice. http://www.arcticatlas.org/atlas/cavm/cavmavhrr/
Build a model of a remote sensing satellite. Use your model of a satellite to transform reflected visible of different frequencies into electrical signals with different voltages. Use different colors of paper to calibrate the model. Create a model of a landscape using three different colors of paper. Create a “false color” image of the model of a landscape (if time permits). Today’s Remote Sensing Design Challenges
LEDs are usually used to transform an electrical energy into light of a specific frequency (energy). LEDs can also transform light of a certain frequency into an electrical signal with a certain voltage (energy). The key component of a model of a remote sensing satellite is a light emitting diode (LED). http://electronics.howstuffworks.com/led.htm
An electric meter can indicate the voltage of an electrical signal when an LED detects light.The voltage depends on the frequency of light detected by the LED and the intensity of the light. http://mvh.sr.unh.edu/mvhinvestigations/light_investigations.htm
A “Barrier Strip” can be used to create a secure link between the LED and the wires that connect to an electric meter (e.g. a voltmeter). The LED is connected to two terminals on one side of a barrier strip. The alligator clips of wires that connect to an electric meter are attached to the two terminals on the other side of the barrier strip. Alligator clips on wires connected to an electric meter do not make a very reliable connection to the thin lead wires of an LED.
Directions for building a model of a remote sensing satellite are found on Page Two of the Build and Calibrate a Remote Sensing Satellite. The procedure for calibrating your model of a remote sensing satellite is found on Page Three of the Build and Calibrate a Remote Sensing Satellite. Page Three of the Remote Sensing Teacher’s Guide includes examples of data collected.
Create a polar landscape using three different colors of paper. Collect remote sensing data as your model satellite passes over the polar landscape. Create a “false color” image of the polar landscape. The Map a Polar Landscape document describes how you can:
How was your false color image of a landscape similar to a false color image of precipitation used in weather reports? How was your false color image of a landscape different from a false color image of precipitation? How could this activity be integrated into your STEM curriculum? What are some ways that students could use the model of a remote sensing satellite to design an investigation. What variations of this activity can be developed? A few questions.