Download
1 / 33
330 likes | 350 Views
Explore how guidelines use barriers to reduce health risks in recycling nutrients from excreta and greywater, including risk assessment, management, and communication. Learn about microbial risk assessment and examples of applications.

E N D
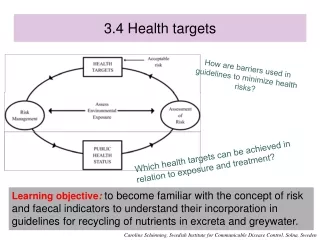
3.4 Health targets How are barriers used in guidelines to minimize health risks? Which health targets can be achieved in relation to exposure and treatment? Learning objective:to become familiar with the concept of risk and faecal indicators to understand their incorporation in guidelines for recycling of nutrients in excreta and greywater. Caroline Schönning, Swedish Institute for Communicable Disease Control, Solna, Sweden
Wastewater, excreta and greywater use – Background and health concerns • Wastewater use is extensive worldwide • 10% of world’s population may consume wastewater irrigated foods • 20 million hectares in 50 countries are irrigated with raw or partially treated wastewater • The use of excreta (faeces & urine) is important worldwide • The extent has not been quantified • The use of greywater is growing in both developed and less developed countries • Direct Health Effects • Disease outbreaks (developing and developed countries) • Contribution to background disease (e.g. helminths + others) • Indirect Health Effects • Impacts on the safety of drinking water, food and recreational water • Positive impacts on household food security and nutrition Caroline Schönning, Swedish Institute for Communicable Disease Control, Solna, Sweden
Risk assessment and analysis – new way to quantify and manage risks • Risk assessment • Qualitative or quantitative estimation of possible negative health effects associated with exposure to a certain hazard • Risk management • Control and management of risks, weighing alternatives, standpoints, implementation of legislation, etc. • Risk communication • Communication (two way-communication) of risks to responsible bodies, ”stakeholders”, the public Includes: Hazard identification Exposure assessment Dose-responseassessment Risk characterisation Caroline Schönning, Swedish Institute for Communicable Disease Control, Solna, Sweden
Why risk assessment? • Surveillance systems underestimate number of cases • Emerging pathogens • Indicator organisms • Coliforms, enterococci, clostridia, bacteriophages • Difficult to detect pathogens • Epidemiological investigations • Limited detection level • Expensive • Retrospective • To refine the establishment of guidelines • Prospective studies • Compare ”future” systems e.g. sanitation systems Caroline Schönning, Swedish Institute for Communicable Disease Control, Solna, Sweden
Microbial risk assessment -Examples of application (1) • Ensure the quality of provided food during production and further handling • Determine whether the drinking water treatment is satisfactory relation to the accepted level of infection in society • Assess different exposures and how pathogen transmission can be avoided in new systems, e.g. local reuse of faeces or greywater • In comparisons of e.g. different wastewater systems • Predict the “burden” of waterborne diseases in the society during endemic and epidemic situations • Find the most cost-effective alternative to reduce health risks for food consumers Caroline Schönning, Swedish Institute for Communicable Disease Control, Solna, Sweden
Step 1: Hazard identification and how to estimate the amount of pathogens • Direct counts • often possible, but problematic if the risk level isbelow the microbe detection level e.g. 500 samples á 2 000 L to detect “acceptable” Cryptosporidium risk • Analysis of index organisms • the density assumed to be proportional to pathogen(s)e.g. Clostridium perfringens for viruses/protozoa (in water treatment) • Indirect measurements • measure the concentration of index organisms in incoming water and their reduction, e.g. 10 Cryptosporidium/20 L raw water and the reduction of Bacillus spores in the treatment plant indicates a 2,9 log10 reduction • Estimates from e.g. reported cases (surveillance, epidemiological data, urine example) Caroline Schönning, Swedish Institute for Communicable Disease Control, Solna, Sweden
Step 2 a: Exposure (examples) Ex. 1: Ingestion of drinking water contact rate 1.4 L/day exposure frequency 365 days/year if the drinking water is assumed to contain 0.001 virus/L 1.4 x 0.001 = 1.4 x 10⁻³ viruses/day will be ingested Ex. 2 : Ingestion of bathing water (surface water) contact rate 50 mL/h 2.6 h/swim exposure frequency 7 swims/year daily average 7/365 x 2.6 x 0.05 = 0.0025 L/day If the bathing water is assumed to contain 0.1 virus/L 0.0025 x 0.1 = 2.5 x 10⁻⁴ viruses/day will be ingested Caroline Schönning, Swedish Institute for Communicable Disease Control, Solna, Sweden
Step 4: Risk characterisation • Data from steps 1-3 are needed to calculate the probability of being infected and the health burden for the society. In step 4 variation and uncertainty in the data are being discussed. • ”Variability” – internal variation in data cannot be reduced • ”Uncertainty” – variation in the data set can be reduced by collecting more data from additional studies Caroline Schönning, Swedish Institute for Communicable Disease Control, Solna, Sweden
Linking tolerable disease burden and quality of water source for some reference pathogens Example calculation (WHO, 2004)
Drawbacks in microbial risk assessment • Dose-response models are based on healthy individuals • Do not consider vulnerable population • The elderly and very young, pregnant women, immunocompromised persons make up some 20% of the population • Most models do not include the whole population • Secondary spread, immunity • Dynamic models • Requires complicated mathematics Caroline Schönning, Swedish Institute for Communicable Disease Control, Solna, Sweden
Health-based targets and acceptable risk • Examples of acceptable risk • US-EPA acceptable risk for drinking water: 1:10 000 per year (10-4) • Haas (1996) acceptable risk for waste products: 1:1 000 per year (10-3) • Health-based target • Based on standard metric of disease e.g. DALYs and WHO (10-6) • Appropriate health outcome (”prevention of exposure …”) Simplified framework for WHO Guidelines (Bartram et al. 2001)
WHO Guidelines – risk Performance targets for selected bacterial, viral and protozoan pathogens in relation to raw water quality (to achieve 10-6 DALYs per person a year) Caroline Schönning, Swedish Institute for Communicable Disease Control, Solna, Sweden
How can we use the indicators? An indicator is used to: • indicate presence of other organisms e.g. pathogens • mimic the behaviour of another organism (index organism) • represent a whole group of organisms (model organism ) • trace movements of viruses in soil (bacteriophages) • indicate reduction processes (Ascaris) Temperature – safety zone Source: Feachem 1983; EC 2001 Caroline Schönning, Swedish Institute for Communicable Disease Control, Solna, Sweden
Indicators for testing water and wastewater quality Examples of indicator organisms: • Drinking water – heterotrophic bacteria, E. coli • Recreational water – E. coli, total coliforms (previously), faecal streptococci (EU) • Excreta and wastewater (for irrigation) – coliforms, intestinal nematodes (WHO 1989) • Sewage sludge – coliforms, Salmonella, (Ascaris, viruses – validation (US EPA)) • Guidelines & regulations – now these rely less on indicators Caroline Schönning, Swedish Institute for Communicable Disease Control, Solna, Sweden
Presence of indicator bacteria in waste Concentrations of indicator bacteria in faeces, incoming and outgoing wastewater from wastewater treatment plants and in raw sludge CFU/g ww or CFU/ml measure the number of colony–forming units per gram of wastewater or per milliliter respectively (Geldreich 1978; Stenström 1996; Sundin 1999)
What is an ideal faecal indicator organism? • The indicator is in the intestinal microflora • Present in greater numbers than the pathogen itself • Do not multiply in the environment • Are non-pathogenic • Occur together with pathogens • Equally persistent as pathogens • Detected easily with affordable methods Indicator organisms are to: indicate a presence of e.g. faecal contamination of human faeces, sewage, animal dropping, etc. • Why do we want indicators? • There are hundreds of pathogens species – too many • Pathogens are often present in low concentrations – therefore hard to detect • Pathogens are difficult and expensive to count/analyse Caroline Schönning, Swedish Institute for Communicable Disease Control, Solna, Sweden
Faecal indicators – abundant in faeces (Geldreich 1978, Havelaar et al. 1991)
Faecal indicators in urine • Number of E. coli– sensitive to the conditions prevailing in urine • Very high numbers of faecal streptococci – possible growth in the pipes (sludge formed) • No reduction of clostridia (spores) during storage – resistant to most conditions • Would mean that the faecal cross-contamination is either underestimated or overestimated • How does the survival of pathogens relate to the behaviour of the indicators? Caroline Schönning, Swedish Institute for Communicable Disease Control, Solna, Sweden
Are the indicators always reliable? • Potential growth in greywater: • E. coli show~1000 times higher faecal contamination than the chemical compound coprostanoldue to growth • Faecal streptococci show ~100 times higher contamination than coprostanol • Potential growth in wastewater: • Indicator bacteria show ~10 times higher faecal contamination than the chemical compound coprostanol Possible growth in faecal matter/sludge/urine Overestimation of the risk (Ottoson, 2005) Caroline Schönning, Swedish Institute for Communicable Disease Control, Solna, Sweden
Need to look for alternatives to indicators – related to sanitation and agricultural practices • Quality guidelines (e.g. WHO) • indicators are found to be of limited value • expensive, time-consuming to monitor • Process guidelines (e.g. sludge treatment) • monitoring of process parameters • validation may be needed • Other practical recommendations • e.g. restrictions for use • Combinations of the above Caroline Schönning, Swedish Institute for Communicable Disease Control, Solna, Sweden
Recommendations for the use ofhuman urineindicator-free recommendation for large systems *From potential faecal cross-contamination and possibly remaining after storage * Inactivation affected by pH (~9) and ammonia, avoid dilution of the urine Caroline Schönning, Swedish Institute for Communicable Disease Control, Solna, Sweden
When and where to apply human urine? • For crops that are to be consumed raw, one month should pass between application and harvesting (withholding/waiting period) • Urine from a single household can be applied for all types of crops, provided that • the crop is intended for consumption in the grower´s household • one month passes between fertilisation and harvesting • We can apply even simpler or less strict guidelines for urine if • The system seems to function well – with no visible faecal cross-contamination • Information is given to workers (e.g. farmers) who handle the urine • Higher temperature of the urine allows for shorter storage time Caroline Schönning, Swedish Institute for Communicable Disease Control, Solna, Sweden
Health protection measures • Aimed at different groups at risk of exposure • Food produce consumers • Workers and their families • Local communities • Different types of measures, such as: • Technical barriers: treatment, application • methods • Behavioural aspects: hand hygiene, food preparation, use of personal protective equipment • Medical: Immunization • Education: health and hygiene promotion • Environment: Vector control Caroline Schönning, Swedish Institute for Communicable Disease Control, Solna, Sweden
Treatment of excreta and greywater • Faeces • Storage, composting and alkaline treatment • Further research and adaption to local conditions recommended • Compare to Modules 4.2-4-4 (which build on further research) • Urine • As table above, builds on Swedish recommendations • Compare to Module 4.2 • Greywater • Different techniques described, dependent on local conditions • Compare to Modules 4.5-4.7 (details of treatment processes) Caroline Schönning, Swedish Institute for Communicable Disease Control, Solna, Sweden
Performance targets for viable helminth eggs when applying faecal matter and faecal sludge to fields Starting point Wastewater performance target for unrestricted irrigation: ≤ 1 helminth egg/l Yearly helminth load from irrigation (applying e.g. 500 mm/year):≤ 500 helminth eggs/m² Application of faecal matter (in same quantities as in good agricultural practice of manure application):10 ton manure/ha per year at 25 % TS = 250 g TS/m² per year [helminth eggs]tolerable≤ 500/250 = 2 helminth eggs/g TS i.e. dry-weight faecal matter/sludge must contain ≤ 2 eggs/g Caroline Schönning, Swedish Institute for Communicable Disease Control, Solna, Sweden
Health protection measures - agriculture • Waiting or withholding periods • Stopping irrigation several days before harvest to allow natural pathogen die-off is appropriate in a cooler season or climate but makes leafy vegetables look unfit for sale under hotter conditions. • Application techniques • In some countries, like India and Kenya, drip kits are easily available while these are rare in others. • Crop restriction • Depending on local diets and market demand, some farmers have the option to change crops, while others are constrained in this respect. • FAO supports reuse (recycling) by issuing own guidelines. Caroline Schönning, Swedish Institute for Communicable Disease Control, Solna, Sweden
Options for the reduction of viral, bacterial and protozoan pathogens that achieved a health based target of ≤10-6 DALYS pppy (examples) Less treatment maybe more economical • Because normally microorganisms content in wastewater is very high what it is defined is log removal/inactivation Washing = More public involvement California Title 22 ≤ 2.3 FC/100 ml (virtually Zero) ONLY with treatment Developed countries Developing countries Less treatment implies more supervision sites Monitoring WWTP at T level Involuntary soil ingestion by farmers Caroline Schönning, Swedish Institute for Communicable Disease Control, Solna, Sweden
Definitions of monitoring functions Caroline Schönning, Swedish Institute for Communicable Disease Control, Solna, Sweden
Guideline values for verification monitoring (1) Caroline Schönning, Swedish Institute for Communicable Disease Control, Solna, Sweden
Guideline values for verification monitoring (2) • Verification monitoring • Greywater, faecal sludge and (dry) faeces • Harmonised with wastewater use in agriculture (WHO, volume 2. 2006) • Mainly applicable in larger systems • E. coli – caution due to growth • Helminth eggs – where applicable • Sampling and laboratory procedures Caroline Schönning, Swedish Institute for Communicable Disease Control, Solna, Sweden