Download

1 / 12
0 likes | 7 Views
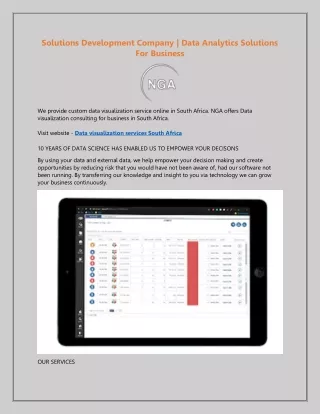
Unlock actionable insights with our expert data visualization consulting services. We transform complex data into intuitive visuals for smarter decision-making.

E N D
DATA ANALYTICS AND VISUALIZATION SERVICES Transform your dispersed data into informed decisions with Hexaview’s powerful data analytics services. Talk To Our Expert Tell us a few things We’ll help you work through the contact details Full Name* Business Email* Company Name* Tell us your requirements* I have read and agreed to the Hexaview's Privacy Policy SCHEDULE A CALL SCHEDULE A CALL Cookie Consent Trusted by Data Driven Companies By clicking “Accept Cookies”, you agree to the storing of cookies on your device to enhance site navigation, analyze site usage and assist in our marketing efforts. More info Accept Cookies Reject Cookies
Every Picture Tells a Story. What Does Your Data Tell? Revamp your raw data into informative visualizations and discover powerful stories! Interact with data flexibly and seamlessly with our data visualization services. Importance of Data Analytics &Visualization in Business Helps make strategic decisions by providing insights from raw data, which eliminates uncertainty and enhances results. Enables businesses to optimize resource allocation and streamline operations by assisting in the identification of process inefficiencies. Analyzes consumer trends and preferences to help companies improve customer satisfaction by customizing products, services, and marketing strategies. Helps companies stay ahead of the competition by providing a deeper understanding of market trends. Facilitates the identification of ROI opportunities, trend forecasting, and improved pricing strategies for increased profitability. Ensures accuracy and consistency in analysis by combining data from multiple sources to present a single, cohesive view. Draws attention to irregularities or differences in datasets, ensuring cleaner data for more reliable analysis. Enhances responsiveness by facilitating the development of dynamic dashboards that monitor key performance indicators (KPIs) in real time. Allows teams to quickly recognize patterns and correlations by breaking down complex datasets into easily interpretable visuals. Uses AI and machine learning algorithms to forecast future trends and recommend actionable strategies.
Data analytics Data analytics is the process of examining and interpreting raw data to uncover useful insights, patterns, and trends that allow businesses to make informed decisions. It involves various techniques, including statistical analysis, data mining, and machine learning to transform data into actionable information that can optimize performance, improve efficiency, and drive growth. Data visualization Data visualization is the process of representing data graphically using graphs, charts, and other visual aids to help people understand complex information. By displaying data in an understandable manner, it facilitates the identification of key insights, trends, and patterns, allowing for speedier and more efficient decision-making. With Our Data Analytics Consulting Services, We Can Running a company requires good decision-making. This requires organizing and presenting data in a way that clearly answers the questions that will drive you to correct well-informed decisions. Our data visualization & analytics services can help you identify trends, comparisons, and performance towards goals and objectives and spot any deviation. Paginated Reports And Dashboards Data Platform Development Dashboard Optimization Data Visualization With Cloud
BI Tools Implementation BI Migration Unlock The True Worth Of Your Data And Drive Smarter Decision-Making With Hexaview GET IN TOUCH We are the ideal data visualization consulting services company for you Our world-class data analytics and visualization services help you see the 360-degree view of your business by transforming raw data into charts, graphs & maps providing valuable insights. Outcome Focused Having 14+ years of experience, we help companies understand the importance of digitization in grabbing strategic opportunities and solving real-world business problems.
Collaborative & Communicative Complete project transparency and multiple open lines of communication from day one. We’re available when you need us and continually update you on your project’s status. Proven, Rapid & Trusted Delivery We have a world-class NPS that is an indicator of overwhelming customer loyalty. Our streamlined delivery and cost-effective engagements are designed to match your goals, timeline, and budget. Talk to us to get the best data visualization services for your business. Talk To Our Expert Tools & Technologies Used Data Visualization Platform Power BI Tableau JMP Microsoft Excel Datawrap Visualization Libraries JS Charting Fusion Charts Chart JS D3.js High C Cloud- Based Solution Google Data Studio Amazon QuickSight Azure Monitor Data Visualization Types
Temporal Data Visualizations These data visualizations show trends, patterns, and changes throughout time. Common examples include line charts, area graphs, and timelines. They are perfect for analyzing performance, predicting outcomes, or comparing periods. Hierarchical Data Visualizations Designed to represent relationships within structured data, they display parent-child connections. Examples include tree diagrams, dendrograms, and sunburst charts. They help explore organizational hierarchies, categories, or nested datasets. Multi-Dimensional Visualizations These provide a comprehensive picture of complex datasets by displaying data across multiple variables at once. Commonly used visuals include parallel coordinate plots, bubble charts, and scatter plots. They are great at identifying relationships, trends, and outliers. Geospatial Data Visualizations These visualizations reveal geographic trends and distributions by mapping data to physical locations. Examples include heatmaps, choropleth maps, and dot distribution maps. They are frequently used for demographic research, logistics, and location-based insights. Industry Used Cases
Retail In retail, data analytics helps businesses forecast sales, manage inventory effectively, and understand customer behavior. This results in increased sales and optimized inventory management, enhancing overall operational efficiency. Financial Services The financial services sector utilizes data visualization and analytics to enhance portfolio management and investment analysis. This enables professionals to make informed decisions quickly, improving overall efficiency and client satisfaction. Marketing Marketing professionals use analytics to assess campaign performance and customer segmentation. Data visualization provides insights that help optimize marketing strategies, increasing return on investment (ROI) for various campaigns. Healthcare In healthcare, data analytics plays a crucial role in analysing patient data and operational efficiency. Visualizing trends helps improve patient outcomes and streamline processes, ultimately leading to better healthcare delivery.
Manufacturing Manufacturing industries apply data analytics for supply chain optimization and quality control. Visual insights into production data enhance operational efficiency, reduce waste, and improve overall productivity across manufacturing processes. Supply Chain Data visualization and analytics in the supply chain industry enhance efficiency by providing real-time insights, optimizing operations, and enabling better decision-making through interactive graphs and dashboards that reveal complex data patterns. Why Hexaview For Data Visualization Services? When it comes to data visualization, security is a top priority. At Hexaview, we understand the importance of safeguarding your data while transforming it into actionable insights. Our services ensure that your sensitive business information remains protected at every step. We implement industry-leading security practices, including encryption, access controls, and secure data storage, to keep your data safe. With Hexaview, you can trust that your visualized data not only empowers your decision-making but also maintains the highest standards of confidentiality and integrity. Choose us for robust, secure, and effective data visualization solutions tailored to your business needs. Ready to discuss your Data Analytics and Visualization Services’ needs?
Reach out to our expert data analytics consultants to discuss how Hexaview can make your data work harder for you. BOOK YOUR FREE CONSULTATION HERE Our Data Visualization Services at Hexaview Technologies enable organizations to turn complex data into easy-to-understand, actionable insights. Working in tandem with our Data Analytics Services, we create visually compelling dashboards and reports that empower businesses to make data-driven decisions. Whether you're leveraging our Data Lake Solutions or integrating with Data Warehouse Solutions, our visualization tools ensure you get the most out of your data, helping drive efficiency and strategy. Frequently Asked Questions Can't find the answer you're looking for ? Our FAQ section provides quick, helpful information on our products, services, and policies. What is Data Visualization and why is it important? Can you explain how Data Visualization Software differs from Data Visualization Tools? What are the types of Data Visualization you offer? How do you handle Big Data Visualization? What are Data Visualization best practices?
How do you ensure the security and privacy of the data used in Visualizations? Do you provide training on Data Visualization Tools and Techniques? What is the typical timeline for completing a Data Visualization project? What are the best Data Visualization Tools available? How does Python Data Visualization fit into your services? What is Interactive Data Visualization and how can it benefit my business? What Data Visualization Techniques do you use? Can you integrate Data Visualization with other Business Intelligence Systems? What is the process for Developing a custom Data Visualization solution? How can i get started with your Data Visualization services? Discover your digital transformation journey Let's do something amazing together Schedule Your Consultation → Services
Salesforce Wealth Management Data Science Lending Cloud Services Capital Market Enterprise Software On-Demand Solutions Products ReportWa PDF Scrapper Video Statements AlHexa Chatbot Quick Quote Co-Pilot Quick Links About Us Blog Security Case Studies Tech Stack Press Release Career Social Impact Connect with Us hello@hexaviewtech.com +1 (646) 455-1595 Hexaview Technologies, Inc. Headquarters (USA) 43 W 23rd St, 2nd floor, New York, NY 10010, United States
Stay in the know with our newsletter Subscribe Enter Email Copyright © 2024 Hexaview Technologies, Inc. Privacy Policies Cookie Policy Terms and Conditions Legal Notice