
Addressing Duck Chart Issues and Strategies for 2020 Ramp Rates
This document addresses the challenges associated with the Duck Chart, highlighting the projected ramp rates for 2020, including a peak of 13,500 MW in 2 hours and significant variations in net load throughout the day. It analyzes the highest net load at 33,400 MW at 7 PM and the lowest at 19,600 MW at 4 PM, exploring solutions such as import/export strategies, demand response, energy storage, and curtailment to effectively manage these ramping issues and ensure grid stability.

Addressing Duck Chart Issues and Strategies for 2020 Ramp Rates
E N D
Presentation Transcript
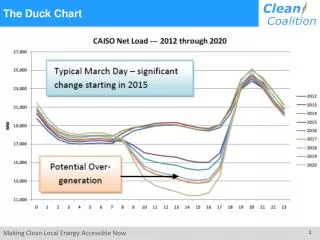
Projected 2020 Ramp Rates 13,500 MW in 2 hours 6,300 MW in 2 hours 8,000 MW in 2 hours
Addressing the Duck Chart Highest net load: 33,400 MW at 7pm Lowest net load: 19,600 MW at 4pm
Addressing the Duck Chart with Import/Export Import/Export
Addressing the Duck Chart with Demand Response Demand Response
Addressing the Duck Chart with Energy Storage Energy Storage
Addressing the Duck Chart with Curtailment Curtailment