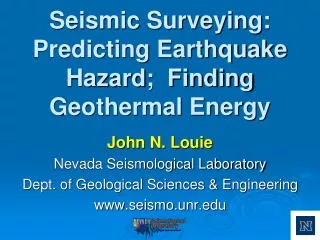
Predicting Earthquake Shaking and Hazard
390 likes | 565 Views
Predicting Earthquake Shaking and Hazard. John N. Louie , Nevada Seismological Lab. with UNR undergraduate interns: Will Savran , Brady Flinchum , Colton Dudley, Nick Prina and Geology B.S. graduate Janice Kukuk. Last Week’s Earthquake in Christchurch, New Zealand.

Predicting Earthquake Shaking and Hazard
E N D
Presentation Transcript
Predicting Earthquake Shaking and Hazard John N. Louie, Nevada Seismological Lab. with UNR undergraduate interns: Will Savran, Brady Flinchum, Colton Dudley, Nick Prina and Geology B.S. graduate Janice Kukuk
Last Week’s Earthquakein Christchurch, New Zealand • Magnitude 6.3 aftershock of M 7.1 in Sept.
Unexpectedly Intense Ground Shaking • Horizontal accelerations >2 times gravity
What Happens with Such Intense Shaking? • >200 deaths, 1/3 of city’s buildings destroyed Stuff.co.nz
Could It Happen Here? Photos by Marilyn Newton, Reno Gazette-Journal It Already Did! Wells, Nevada, Feb. 2008
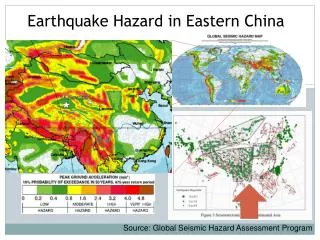
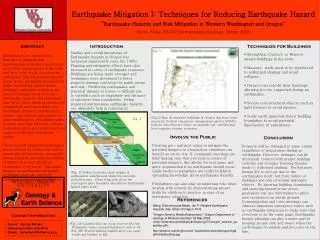
How Do We Protect Nevada’s People and Economy from Earthquakes? • Stiffen building codes to strengthen buildings everywhere? • But, would make construction too costly • Improve our understanding of earthquake shaking • What areas have high hazard? Put resources there. • Don’t waste money reinforcing safer areas
Three Elements to Predicting Shaking (1) Where are the earthquake sources? • Discover and locate faults with seismic monitoring and surveying • Characterize faults with geology and seismic surveying (2) How will the waves propagate from the sources? • Characterize basins with gravity and seismic surveying (3) How will the soils under your property react? • Seismic microzonation with Parcel Mapping • Scenario predictions with “Next-Level ShakeZoning” • Use physics and geology to get realistic shaking predictions for likely earthquakes • Combine predictions with probability of each earthquake • Nevada researchers are working on these challenges.
Adding Fault Geology Black Hills Fault in Google Earth with USGS Qfaults trace
Adding Geology & Geotechnical Data Black Hills Fault in Google Earth with USGS Qfaults trace Earthquake Magnitude from Fault Size M0 = μAd μ = 3x10¹¹ dyne/cm2 A = Fault Area (cm2) = (9 km length)(105 cm/km) (9 km width)(105 cm/km) d = fault displacement = 200 cm (from geologists)
Adding Geotechnical Data ShakeZoning Geotech Map Obtained by Clark Co. and City of Henderson 10,721 site measurements
Adding Physics 2nd-order PDE controls P(x,y,z) wave’s evolution in time Uses Laplacian to get spatial derivatives Use definition of derivative to compute a Finite Difference (don’t take limit)
Wave Computation on a 3D Geological Grid Fine grid gives accurate FD estimate of derivatives Finer grid takes longer to compute, higher cost Finer grid for higher shaking frequencies
Adding Physics • Black Hills M6.5 event • Short trace but 4-m scarps noted • Viscoelastic finite-difference solution • 0.5-Hz frequency • 0.20-km grid spacing • A few hours on our small cluster • Map view of waves • Mode conversion, rupture directivity, reverberation, trapping in basins
Showing 3-DVector Motions • 3 computed components of the ground particle velocity vector: • (x, y, z) • 3 components of color on your computer screen: • (R, G, B) • red, green, blue
Showing 3-D Vector Motions • 3 computed components of the ground particle velocity vector: • (x, y, z) • 3 components of color on your computer screen: • (R, G, B) • red, green, blue from MathWorks.com
Showing 3-DVector Motions • 3 computed components of the ground particle velocity vector: • (x, y, z) • 3 components of color on your computer screen: • (R, G, B) • red, green, blue
Showing 3-DVector Motions • 3 computed components of the ground particle velocity vector: • (x, y, z) • 3 components of color on your computer screen: • (R, G, B) • red, green, blue
Showing 3-DVector Motions • 3 computed components of the ground particle velocity vector: • (x, y, z) • 3 components of color on your computer screen: • (R, G, B) • red, green, blue
Showing 3-DVector Motions • Add the color components to get a perceived color • Color depends on strength and direction of wave vibration
Adding Physics • Cue up and play: BH-ClarkCo-0.5Hz.m4v • Timelapse animation • 60 seconds wave propagation compressed to 16.6 sec video • Time compression factor of 3.6
Adding Physics • Cue up and play: BH-ClarkCo-0.5Hz.m4v • 0 seconds after rupture begins on the Black Hills fault (9 km down) • Las Vegas basin in shaded relief FM LV H BH
Adding Physics • Cue up and play: BH-ClarkCo-0.5Hz.m4v • 2.2 seconds after rupture begins on the Black Hills fault • Seismic waves reach the surface in Eldorado Valley FM LV H BH
Adding Physics • Cue up and play: BH-ClarkCo-0.5Hz.m4v • 6.9 seconds after rupture begins on the Black Hills fault • P wave in Las Vegas, small (dark yellow) • Intense surface waves funneling into Henderson FM LV H BH
Adding Physics • Cue up and play: BH-ClarkCo-0.5Hz.m4v • 13.4 seconds after rupture begins on the Black Hills fault • Rayleigh wave in W. Las Vegas, large (red-blue) • Like ocean wave: vertical in between radial motions FM LV H BH
Adding Physics • Cue up and play: BH-ClarkCo-0.5Hz.m4v • 23.9 seconds after rupture begins on the Black Hills fault • Rayleigh wave carrying energy to Pahrump • Much energy left behind in soft geologic basins FM LV H BH
Adding Physics • Cue up and play: BH-ClarkCo-0.5Hz.m4v • 45.2 seconds after rupture begins on the Black Hills fault • Rock areas like FM insulated from shaking • Shaking trapped in basins, radiating out FM LV H BH
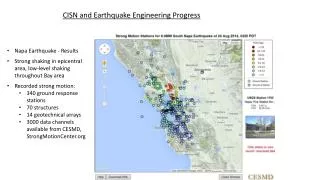
Black Hills M6.5 Scenario Results • Max Peak Ground Velocity (PGV) >140 cm/sec • PGV over 60 cm/sec (yellow) bleeds into LVV by Railroad Pass • Large event for a short fault • Geologists are divided on likelihood • Need to know how likely
Frenchman Mountain Fault M6.7 Scenario Possible Scarp in Neighborhood Event Inside the LVV Basin
Frenchman Mountain Fault M6.7 Scenario Event Inside the LVV Basin • Cue up and play: FMF_ClarkCo_0.5Hz_24fps.m4v • Timelapse animation • 60 seconds wave propagation compressed to 24 sec video • Time compression factor of 2.5
2-Segment Frenchman Mtn. Fault M6.7 • All of Las Vegas Valley shakes as hard as Wells in 2008 (20 cm/s) • Higher shaking in areas of refraction and focusing • Less shaking in west Valley: stiffer soil
Combine the Scenarios Probabilistically λ = annual frequency of exceeding ground motion u0 rate(M, sourcej) = annual rate of occurrence for an earthquake with magnitude M at source locationj P = probability of ground motions u≥ u0at sitei, if an earthquake occurs at source locationjwith magnitude M
US Geological Survey Hazard Maps • On line at http://earthquake.usgs.gov/hazards/ • Mostly from past earthquakes • No wave physics
Model Setup • Two Basin-Thickness Datasets: • Widmer et al., 2007 Washoe Co. gravity model • Saltus and Jachens 1995 gravity model • Two Geotech Datasets: • Pancha 2007 ANSS station measurements • Scott et al., 2004 shallow shear-velocity transect • Scenario Fault (like 2008 Wells): • Strike: N-S • Motion: Normal- down to the west • Length: 7.58 km • Mw: 5.94 (Anderson et al., 1996) • Frequency: 0.1 Hz and 1.0 Hz
Physics-Based Wave Propagation 0.1 Hz Model 1.0 Hz Model • Cue up and play DowntownReno-1Hz-5.04M.m4v • The basin amplifies and traps seismic shaking • Wave propagation unaffected by basin dataset boundaries in the 0.1 Hz Model • Wave propagation is affected by basin dataset boundaries in the 1.0 Hz Model- but not in basin
Peak Ground Velocities (PGV) Max PGV: 22 cm/s Max PGV: 46 cm/s