Download
1 / 23
230 likes | 334 Views
Evaluate Statistically Based Reports ( AS 3.12). Workshop AJ. Margin of Error :Clarifying the rules of thumb. Dru Rose (Westlake Girls High School). The purpose of this workshop. To clarify the rules of thumb for estimating MoE and their relationship to theory .

E N D
Evaluate Statistically Based Reports ( AS 3.12) Workshop AJ Margin of Error :Clarifying the rules of thumb Dru Rose (Westlake Girls High School)
The purpose of this workshop • To clarify the rules of thumb for estimating MoE and their relationship to theory . • To demonstrate the power of technology for developing the concept of margin of error (making the topic accessible to a wider diversity of students than a theoretical approach relying on the central limit theorem and the normal distribution). • To share two activities I have developed for clarifying the rules of thumb with students. Dru Rose
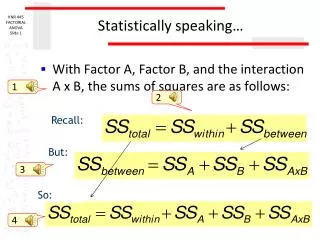
3 types of claim and rules of thumb: • Single poll % 51% of young people agree there is too much sex, violence and bad language on TV MoE ≈ • Comparison within one group Young people are more likely to agree than disagree MoE for the difference ≈ 2 x MoE • Comparison between independent groups Young women are more likely to agree than young men MoE for the difference ≈ 1.5 x Average MoE Dru Rose
Where do the rules of thumb come from? MoE ≈ • Single poll % Media reports use a 95% level of confidence. Usual theoretical formula for standard error of a single proportion 1.962, n in large samples: MoE (p) 2 ≈ Dru Rose
Where do the rules of thumb come from? 2. Comparison within one group MoE for the difference ≈ 2 x MoE and If p ≈ 0.5, (i.e. two main options with others having very small support) then + ≈1 , - ≈ 0, 1.96≈ 2 , and for large samples n -1≈ n, MOE(p1− p2)≈ 2 × = 2 x MoE Dru Rose
Where do the rules of thumb come from? 3. Comparison between 2 independent groups MoE for the difference ≈ 1.5 x Average MoE When p1 and p2 ≈ 0.5 and n1 = n2= n, and 1.96 ≈2, this formula reduces to : 2 × = ×. We can show that “1.5 ×Average MoE” is a reasonable approximation in most situations: Dru Rose
Developing the rules of thumb with students:Use of technology (Central Limit Theorem and normal approximation to binomial distribution no longer in NZEA Level 3 ) MoE ≈ • Single poll % • Wild’s animations show: (i) need for large sample sizes to keep MoE around 5% or below. (ii) Max MoE when =50% and rule of thumb is OK for 30% ≤≤ 70%(Outside this range MoE is much smaller-dropping to almost half when = 10% or 90%) Dru Rose
Developing the rules of thumb with students:Use of technology (Single poll % MoE ≈ ) • We can use the KareKare cards and bootstrap and coverage VIT modules in iNZight to develop the concept of a CI for a poll% and the rule of thumb (see the 2012 Stats Day presentation on Census at School)
n=100 MoE half as long as CI ≈ 10% =
Developing the rules of thumb with students:Use of technology (Single poll % MoE ≈ ) • We can use the coverage spreadsheet developed by Chris Wild and Dave Smith to show that the rule of thumb gives about 95% coverage for realistic sample sizes of around say n= 600
Developing the rules of thumb with students:2. Comparison within one group 2 x MoE • We cannot use iNZight this time. • The rule hinges on the premise that there are two main options with others having very small support. When this is the case, the following argument is valid: Suppose one option has 55% support and the second has 45% support, with a poll MoE of 5%. The first option could have as low as 50% support and the second as high as 50% support. We need a poll% difference between them of more than 2 x MoE (i.e.>10%) to conclude that the first option has more support.
Developing the rules of thumb with students:2. Comparison within one group 2 x MoE • Use of technology: • We can use the coverage spreadsheetto demonstrate that the 2 x MoE rule generally gives about 95% coverageprovided there are two main options with close to 50% support and other options having very little support. • when support for other options is substantial, e.g. current Green Party support, the 2 x MoE rule for the main players over-estimates the MoE for the difference)
Developing the rules of thumb with students:3. Comparison between 2 independent groups 1.5 x Average MoE • We can use the KareKare cards and bootstrapVIT module in iNZight, with the sample within groups option. (Students can watch the differences arrow flip direction and note how often negative differences are produced.)
Developing the rules of thumb with students:3. Comparison between 2 independent groups We can use the coverage spreadsheet to demonstrate that the “1.5 x Average MoE” rule gives about 95% coverage in most real polling situations:
Developing the rules of thumb with students:3. Comparison between 2 independent groups 1.5 x (1/+ 1/)/2 • Consider the following extreme scenario: Suppose = 1000, = 500 and(extreme values for rule of thumb and sample sizes) Correct formula: MoE difference = 5 perc. points Rule of thumb: MoE difference = 5.7perc. points poll% difference = 5.5 percentage points which is actually significant but rule of thumb would suggest otherwise. Butgenerally p≈50% and ≈
How can we help students sort out which rule to apply when testing claims in the media?
Testing claims in the media • The Herald Digipoll survey found 59.2 per cent support across the Super City for the new no-mow policy. • Test the claim that: • “Most Aucklanders… appear to support the controversial council decision to stop mowing roadside berms” • MoE = = 4.5% • 2. women were more in favour [of the policy] than men. • (You may assume that equal proportions of men and women were sampled). • MoE = = 6.3% MoE diff = 1.5 54.7% 17.8 p pts -1.2 p. pts 54.7% 59.2% 8.3p.pts (63.2 – 54.9)
3. In the former Auckland City, a higher proportion of residents disagreed than agreed with the new policy. Diff = 46.3 – 43.6 = 2.7 p. pts = 8.1% 2× MOE = 16.2 % Claim NOT supported 19.1 p pts 41.6 p pts -13.5 p. pts -2.4 p. pts 2.7p.pts 19.6p.pts 4. Can it be claimed that support is consistently higher outside the old central Auckland area? Franklin pop. Only 4.5% n = 22 =21.3% Auckland = 8.1% Av. MoE = 14.7% Diff: 63.2-43.6 = 19.6 p.pts 1.5× Av. MoE = 22% Claim NOT supported
Research New Zealand Survey 28/02/2012: “Are Our Buildings Safe toOccupy?”