Download
1 / 30
300 likes | 424 Views
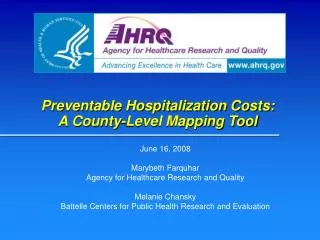
Preventable Hospitalization Costs: A County-Level Mapping Tool. June 16, 2008 Marybeth Farquhar Agency for Healthcare Research and Quality Melanie Chansky Battelle Centers for Public Health Research and Evaluation. Webinar Overview. Overview of Mapping Tool Demonstration Overview of Data

E N D
Preventable Hospitalization Costs: A County-Level Mapping Tool June 16, 2008 Marybeth Farquhar Agency for Healthcare Research and Quality Melanie Chansky Battelle Centers for Public Health Research and Evaluation
Webinar Overview • Overview of Mapping Tool • Demonstration • Overview of Data • Interpretation and Use of Results • Future Plans
AHRQ Quality Indicators (QIs) • Use existing hospital discharge data, based on readily available data elements • Incorporate severity adjustment methods (APR-DRGs, comorbidity groupings and hierarchical modeling) • Five modules: Inpatient, Patient Safety, Prevention, Pediatric, and Neonatal
Preventable Hospitalization Costs: A County-Level Mapping Tool The mapping tool is a new QI software application designed to help organizations to: • better understand geographical patterns of potentially preventable hospital admission rates for selected health problems. • allocate resources more effectively by calculating potential cost savings if admission rates are reduced.
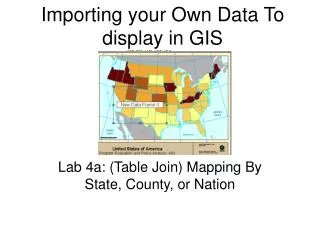
Main Functions of the PHC Tool • Creation of maps that show the rates of hospital admission for selected health problems on a county-by-county basis. • Calculation of potential cost savings that may occur if the number of hospital admissions for selected health problems in each county is reduced. • Ability to place additional information about local populations onto maps to indicate the number of persons who are at greatest risk for those health problems in each county.
It processes all Prevention QIs... There is no longer a PQI 4 and PQI 6.
Underlying Data Used by the Tool • Current indicator specifications • Cost-to-charge ratios • Census data
User-provided data • Most tool functions require data provided by the user • Certain data elements are required for creating maps and calculating county-level QI rates • Some data elements are optional – cost savings and population data
Required Variables The following variables must be present in your data file: • Age (patient age in whole years) • Ageday (patient age in days) • Sex (sex coded 1 for male, 2 for female) • DX1 (ICD-9-CM primary diagnosis) • PR1 (ICD-9-CM primary procedure) • MDC (major diagnostic category) • DRG (diagnosis related group) • PSTCO (county of patient residence) • Atype (admission type) • Asource (admission source)
Optional Variables The following variables are optional, but are needed if the user wants the PHC tool to calculate potential cost savings: • Totchg (total charges) • Hospid (State Inpatient Database hospital identifier)
Optional Population Dataset A second dataset is required if users wish to overlay population information on maps. This dataset must include the following variables: • County (State FIPS code followed by county FIPS code) • Sex (sex coded 1 for male, 2 for female) • Age (age group coded 1 for 0-17, 2 for 18-39, and 3 for 40+) • Pop (population by sex and age cells)
Data Problems • Most reported problems are related to the user datasets. • The QI team can provide technical assistance with your dataset if you cannot solve your problem with the information provided here.
Outputs • All outputs are automatically placed in the folder where your dataset is located • Outputs include: • CSV file • Excel file • Maps
CSV & Excel Files Include: • Numerator count of flagged cases • Denominator count of the at-risk population • Observed rate • Risk-adjusted rate • Standard error of risk-adjusted rate • Whether county is significantly higher or lower than statewide rate • Potential cost savings associated with a 10% reduction in flagged cases (optional)
Maps • Separate maps will be created for each selected QI • Files will be named after the QI, e.g., PQI14, PQI1 • Can be opened and manipulated using any graphics program or picture viewer
There are many possible uses for mapping tool data… • Public Reporting • Intervention Targeting • Tracking Intervention Impact • Identification of Best Practices
…but several issues that must be addressed to effectively use the data • Data leaves you with more questions: Are these rates reasonable? Do they present significant quality concerns? • Excel data needs to be manipulated to present a more dynamic, appealing, and concise data display.
Sources of Comparison Data • State benchmarks (provided by tool) • PQI and PDI User Guides • HCUPnet • NHQR / NHDR
Presentation of Data • Focus on using maps for presentations of data • Focus on using Excel outputs for further analysis or as source data for new graphics • Consider creating concise narrative data summaries
We’re exploring ways to improve the mapping tool… • Incorporation into Windows QI Software • Allow for mapping below the county-level (zip-code, etc.) • Other ideas??
Further Info on the Mapping Tool • 2 versions available: • SAS (requires SAS version 9 or higher and Office 2003 or higher) • Windows (runs on Windows NT, XP, 2000, and Vista only; requires Office 2003 or higher) • Download the Mapping Tool at: http://www.qualityindicators.ahrq.gov/mappingtool.htm
Additional Assistance Technical Assistance: • Margie Shofer,Marjorie.Shofer@ahrq.hhs.gov Senior Program Analyst, Office of Communications and Knowledge Transfer For questions about the tool: • support@qualityindicators.ahrq.gov For more information about AHRQ Quality Tools: • http://www.academyhealth.org/ahrq/qualitytools/index.htm