Download
1 / 26
260 likes | 522 Views
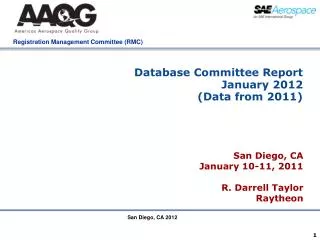
Database Committee Report January 2012 (Data from 2011). San Diego, CA January 10-11, 2011 R. Darrell Taylor Raytheon. Executive Summary. Not all 2011 data is in Database (app. 65%) Reviewed a 12 month rolling number. Agenda. CRB Activity OASIS Entries – Audits OASIS Nonconformities

E N D
Database Committee Report January 2012 (Data from 2011) San Diego, CA January 10-11, 2011 R. Darrell TaylorRaytheon San Diego, CA 2012
Executive Summary • Not all 2011 data is in Database (app. 65%) • Reviewed a 12 month rolling number
Agenda • CRB Activity • OASIS Entries – Audits • OASIS Nonconformities • AS9100 Elements • Feedback
CRB Activity San Diego, CA 2012
8 D Approach • Threshold Violations: • (This section will contain a list and description of the thresholds that were violated • Note: It is not about the individual thresholds, the Corrective Action is being issued because there are multiple threshold violations which may be indicative of a systemic issue with your process)
8 D Approach • Identify Team: • (Because of the nature of this corrective action we recommend that this corrective action not be an individual’s responsibility, this block should identify who was involved in the process) • Describe the Problem: • (Given the information provided, we recommend formulating a problem description based on what you know about your process and the systemic issues identified above.)
8 D Approach • Implement and Verify Short Term Corrective Action: • (This section should identify what is being done immediately to solve the problem, and what was done to verify that those actions were put in place) • Define and Verify Root Cause: • (This section should identify the Quality Science tools used to investigate the problem and how you verified the root cause does in fact exist)
8 D Approach • Verify Corrective Actions: • (This section should contain a look back at the already implemented containment corrective actions and reevaluate them in light of the root cause analysis.) • Implement Permanent Corrective Actions: • (This section should contain the corrective action plan, with milestones, ownership and expected outcomes including a verification and validation plan)
8 D Approach • Prevent Recurrence: • (This section should contain the actions taken to prevent this from re-occurrence, with milestones, ownership and expected outcomes including a verification and validation plan) • Future Steps: • (This section should contain the steps being taken for the future, monitoring the process)
Entries – Audits San Diego, CA 2012
Comparison of Entries 2007 -2011 • Entries: • 2007 – 5114 • 2008 – 5972 ^16% • 2009 – 6969 ^17% • 2010 – 7502 ^7.6% • 2011 – 4848 • As of 12/1 Suspect at this point app. 65% of the data is in Database
SUR=Surveillance REC = Recertification INT = Initial Comparison of Types2007 -2011 65% of data
Standards Entered Into Database 1071 AS9100C as of 12/1/2011
CRB Comments - 2011 • Ratio of Surveillance to Recertification to Initial consistent – potential decrease in initial for the second year in a row • Slow start in AS9100C, perhaps due to timing Going to Rolling Format
Nonconformities San Diego, CA 2012
Pareto of Total Nonconformities Totals 2011 – 14,276 2010 – 20,009 2009 -20,980 2008 -18,803 2007 – 14,957 Average per audit = 2.68 nonconformities, this may be leading to a reduction of nonconformities
Total Not Bell Shaped
Ratio Majors/Entries Totals 2011 - 1271 2010 – 1387 2009 -1135 2008 – 976 2007 - 870 On average, one Major is written every fourth audit Range 0 to 19
Ratio Minors/Entries Totals 2011 – 12,893 2010 – 18,627 2009 -19,414 2008 -17,393 2007 –14,087 On average, 2.4 Minors are written every audit RANGE: 0 - 52
Top 80% of Nonconformities First time in 3 years the order slightly changed
Feedback Analysis 2011 Average to close of “CLOSED” Feedback – 18.54 days Average of those still “OPEN” – 46.7 days
AB Report Card Slight increase in Minors from previous years, Audits and Majors relatively flat: 0 Complaints, 0 Suspensions
Back Up Boston, MA July 19-20, 2011