ANOVAs
ANOVAs. With Richie . Questions we’ll answer today. What is an ANOVA and what does it do? Why do we use an ANOVA? what different types of ANOVA are there ? What criteria does our data have to meet to use an ANOVA ? How do I report an ANOVA? What are post hoc tests?


ANOVAs
E N D
Presentation Transcript
ANOVAs With Richie
Questions we’ll answer today • What is an ANOVA and what does it do? • Why do we use an ANOVA? • what different types of ANOVA are there? • What criteria does our data have to meet to use an ANOVA? • How do I report an ANOVA? • What are post hoc tests? • How do I carry out post hoc tests?
What is an ANOVA and what does it do? • It stands for “analysis of variance” • What is variance? • First things first; what does a t-test do? • How many levels and how many IV’s? • An ANOVA is essentially just a t-test with more IV’s, more levels,or both • It asks “are these means different?”
To ANOVA or not to ANOVA? • The study aimed to see whether colour affected memory for words. We gave people a memory test where the words were in 1 of 4 different colours • The study aimed to see if caffeine affected aggression. Participants were given either high caffeine or low caffeine and we measured their aggression after. • The study aimed to see if student’s motivation to study increased when given chocolate (conditions were ‘chocolate’ and ‘no chocolate’). It also looked the effects of gender and any interactions between the 2. • The study aimed to see if there was a positive relationship between happiness and alcohol consumption
Why do we use an ANOVA? • To test differences between several groups • Instead of doing lots of t-tests, which would increase probability of type 1 error. (More on this later) • To see how 2 variables might interact with each other • For example does MDMA damage the brain? Does gender play a role? • For fun
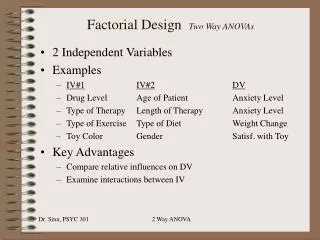
How many ANOVAs are there? • If we have 3+ levels and 1 IV, we do a one way ANOVA • If we have 2+ groups and 2+ IVs, we do a factorial or multi-way ANOVA. • we write this “2x2 ANOVA” or “2x3 ANOVA” • Both of these can have either a within participants (Pps) or between participants IV • A multi way ANOVA might have 2 within Pps IVs, 2 between Pps or a mixed-design which has 1 of both.
Which ANOVA would we use? • The study aimed to see whether colour affected memory for words. We gave people a memory test where the words were in 1 of 4 different colours. Subjects participated in all conditions. • The study aimed to see if student’s motivation to study increased when given chocolate. Subjects were assigned to 2 groups, 1 bar or no bars. It also looked the effects of gender and any interactions between the variables.
ANOVA assumptions • An ANOVA is a parametric test. That means there are some criteria your data must meet if you want to use it. • The data should be normally distributed* • Data should be independently sampled • If you have a independent groups IV, There must be homogeneity of variance • If you have a repeated measures IV, it must have sphericity.
1. Data must be normally distributed • You can get a rough idea by sketching a histogram of your data • But don’t put it in your lab report. • You test it using a Kolmogorov-Smirnov test or a shapiro-wilktest. • The table will look like this • You want a NON significant result (P>0.05) • Report it like this: “A Shapiro-Wilk test of normality showed both the ----- condition (S-W = 0.964, df = 20 P = 0.618) and the ------ condition (S-W = 0.935, df = 20 P = 0.189) met the criteria for normality”
Is it normal? • A Shapiro-Wilk test of normality showed both the broccoli condition (S-W = 0.822, df = 40 P = 0.700) and the spinach condition (S-W = 0.912, df=40 P = 0.092) met/did not meetthe criteria for normality • A Shapiro-Wilk test of normality showed both the high autistic condition (S-W = 0.530, df = 35 P = 0.053) and the control condition (S-W = 0.192, df=50 P = 0.006) met/did not meet the criteria for normality
Reasons for non normality • Skew – you distribution has a tail! • Can be positive (the tail is on the right) • Or negative (tail is on the left) • Kurtosis: too flat (platykurtic) or too pointy (leptokurtic) Why? • Sample size is too small (lower than 30) • Sample size is too big! • Extreme values/outliers • Your groups have very unequal numbers • Some variables like reaction times are nearly always non normal because of their nature
2. Homogeneity of variance (HOV) • Homogeneity literally means “similar” in this case. • The variance in each condition must be similar • This is because we want our IV to affect our DV by increasing it or decreasing it. • If the variance changes then our IV is spreading the data out more, or clustering it together, which we don’t want. • We test this using a Levenes test for HOV • Like with normality tests we are looking for a non-significant result (P>0.05)
Correcting normality/homogeneity of variance • Transform your data. • This is where we play around with it (e.g. add 5 to every score) to make it more normal. • There are lots of ways to do this, and there is no universal method • If you transform one condition you must transform all other conditions, even if they are normal. • Never transform data to make a non significant result significant.
3. Data must be independently sampled • This means that scores within a variable can’t be related. • An example of when this is violated is using twins; If I knew one twin’s score then I could take a good guess at the other’s. • In most cases this isn’t a problem.
4. Data must have Sphericity • Pretty much the same as homogeneity of variance but for repeated measures variables. • the variance of the differences • The test is a mauchleys test for Sphericity. • We are looking for a non significant result again. • If data isn’t spherical then we simply use a Greenhouse-Geisser correction. • SPSS does this for you
Reporting an ANOVA • An one way ANOVA will give you an F-ratio. This tells you if your groups are significantly different. • A multi-way ANOVA will give you 3 F ratios: • One for the effect of each IV (these are called main effects) • And one for the interaction between them (this is called the…..interaction effect!)
What is an interaction effect? • Your IVs might not have an effect on participants on their own, but when they interact they might produce an effect. • E.g. we measure student’s alcohol consumption. We want to see if course plays a part (IV #1), or if students drink more on certain days of the week (IV #2). We test engineering and psychology students. • We find no main effect of day of the week and no main effect of course overall, but we do find an interaction effect. Why might this be? • Tip: think about our time table…..
What is an interaction effect? • Your IVs might not have an effect on participants on their own, but when they interact they might produce an effect. • E.g. we measure student’s alcohol consumption. We want to see if course plays a part (IV #1), or if students drink more on certain days of the week (IV #2). We test engineering and psychology students. • We find no main effect of day of the week and no main effect of course overall, but we do find an interaction effect. Why might this be? • Tip: think about our time table….. Psychology students have Fridays off, Engineers don’t! So psychology students might drink more on a Thursday night, but engineers wont. So Course is interacting with day of the week in this case: there are significant differences in student drinking behaviour but only when we consider both of these factors together
How do I report an ANOVA? • You tell me! • Go through the sheet I gave you and highlight things that you think are important • “when reporting an ANOVA, remember to include ____,________,________,____ ect”
Reporting an ANOVA • To my knowledge there doesn’t seem to be a way of reporting all ANOVAs that you can just memorise (as with the tests last year) boo! • But things you MUST report are: • Your test statistic AKA the F ratio. • Your degrees of freedom • You p value • Any Post hoc tests/planned comparisons • things you could report • Your test for normality • Means and SD’s in the text or in a table • Graph • If you did a multi way ANOVA you are going to have 3 F ratios: one for each IV and one for the interaction between them • You may want to report any simple effects (covered later) • And a graph showing interactions is a must.
Post Hoc tests • Our F-ratio tells us that out of all the groups we tested, there is a difference between them • What is the problem with this?
Post Hoc tests • Our F-ratio tells us that out of all the groups we tested, there is a difference between them • What is the problem with this? • That’s right! We don’t know specifically which conditions are different.
A significant ANOVA result between 3 variables could mean any of these 3 possibilities ! 3 2 1
Post hoc-ery • We use post hoc tests to find out where specifically the differences are. • We compare noC with lowC, noC with highC and lowC with highC. • However whenever we do a test we increase our rate of type 1 error • So we have to adjust our p value to make up for it • by dividing it by the amount of tests we’re going to do • E.g. testing all of the above would mean our pvalue would be 0.05 divided by 3 = 0.0167 so the new alpha level is p < 0.0167 • Not great as adjusting the P value makes the test harder to pass • This is called protecting the family-wise error rate • SPSS does this for you • There are a few different post hoc tests but we’ll use a Bonferonnitest.
A priori/planned comparisons • Pretty much the same as post hoc tests; you do the same thing but plan to do it before you analyse your data. • This is because we might have a rough idea of where the differences are. • For example if we have evidence to think that a little cannabis won’t affect memory, we might test noC and highC and leave out the other 2 comparisons • We do this the same way as the post hoc tests, using a bonferroni correction. • But SPSS doesn’t know how many comparisons
Simple effects • If we have a significant interaction effect, we can explore it by looking at simple effects. • These are just t-tests we run on specific groups to see what the interaction might be. • E.g in a 2x2 ANOVA you have 4 groups, and if we take 2 groups and compare them we’re doing a simple effects analysis. • Remember to control familywise error rate! • Who’d have thought simple effects were so simple?
What I found hardest was….. • Normality • Homogenity of variance • Sphericity • Transformations • Interaction effects • Reporting • Post hoc tests and planned comparisons • Why we control family-wise error rate • Simple effects