Download
1 / 23
230 likes | 259 Views
This article discusses two exceptional events related to ozone and particle pollution in the Southeast, including elevated ozone levels and a PM2.5 smoke episode. It explains the causes, mechanisms of transport, and provides relevant data.

E N D
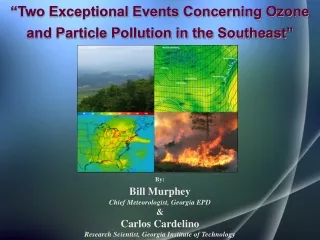
“Two Exceptional Events Concerning Ozone and Particle Pollution in the Southeast” By: Bill Murphey Chief Meteorologist, Georgia EPD & Carlos Cardelino Research Scientist, Georgia Institute of Technology
What is an Exceptional Event? • U.S. EPA defines the term "exceptional event" to mean an event that: • Affects air quality; • Is not reasonably controllable or preventable; • Is an event caused by human activity that is unlikely to recur at a particular location or a natural event; and • Is determined by U.S. EPA through the process established in the regulations, 40 CFR Part 50.14. • http://www.in.gov/idem/5498.htm
Exceptional Events Examples • Case 1 - Elevated ozone levels at three high altitude Smoky Mountain monitors and possible contribution from stratospheric ozone intrusion (Feb 24, 2008 - case study) • Case 2 - Recent PM2.5 smoke episode from Arabia Bay Fire activity in South Georgia (November 12, 2010 - case study)
Case 1: Tropopause Fold HEIGHT, km Schematic diagram illustrating the important features of a typical mid-latitude jet stream tropopause fold (as pioneered by Danielson, 1968). Light arrows indicate cyclonic motion around jet core (J), while dark arrows show vertical motion of tropopause (TROP).1. Note clouds in warm air sector with ascending motion, rising tropopause, and decreasing total column ozone amount.2. Descending motion, a lowered tropopause, drier air, and increased total column ozone is found behind the front and on the south side of the jet.
O3 Measurements at Smoky Mts. Data provided by Jim Renfro High ozone (70s and 80s ppb) measured at 3 high elevation Smoky Mountain sites (near 850mb). Two other lower elevation sites stayed in the 17-23 ppb range. All sites were in the 20's ppb near midnight out ahead of a cold front.
Mechanisms of Transport Across the Tropopause • The jetstream tropopause fold (due to the presence of a strong jet aloft and short wave). b) Subsidence (due to strong Arctic anticyclone) c) Cutoff Lows (tropopause fold occurs during formation of closed Low, typically have interaction of jet streak with a short wave) (a) was the mechanism in this particular case.
TOMS Ozone Data for Feb. 21-25 The TOMS instrument ( OMI/AURA) measures the differential absorption of backscattered UV radiation from the earth's atmosphere absorbed by ozone and the other weakly absorbed. The unit used for ozone measurement in a vertical column having a base of one cm (squared) at STP is defined the Dobson unit (DU). Drier air and lowered tropopause accompanied the increase on 2/24.
Case 2 – Arabia Bay Fire • The Arabia Bay fire, located six to ten miles northwest of Homerville in Clinch County (south Georgia), had burned nearly 3000 acres from Nov 9-29th, as reported the Georgia Forestry Commission. • Satellite photo showing the area in which the Arabia Bay swamp fire was burning. Mainly composed of brush and leaf litter, the fire was believed to be caused by an arsonist. Fire caused dense smoke and reduced visibility in Homerville and Valdosta areas.
High Pressure system centered over the mid-Atlantic moved eastward, keeping mostly dry stable conditions over central and south GA, along with mostly clear skies Good pre-frontal build-up of PM2.5 ahead of the approaching cold front (stagnant conditions) may have helped concentrations at VLD go even higher Satellite Surface Map – Nov 12, 2010
Objective WRF Mesoanalysis • Local model run internally • at EPD. • Domain chosen for fire • region over South Georgia. • Wind (barbs), mean • Sea-level pressure • (contours), and Relative • Humidity (color fill) • are plotted. • Winds veer from northerly • to northeasterly from • 11/13 into 11/14. • PM 2.5 concentrations • rapidly increase on 11/14, • as smoke is transported • from the fire region (near • Homerville) towards the • Valdosta monitoring site. EPD’s WRF-ARW is initialized with NAM12 data
RUC Forecast Time-Height Section For Homerville, GA Light low-level northeasterly flow transported smoke into Valdosta from the fire region
Additional Exceptional Event Example (2/11/08) Warehouse fire in South Fulton County (GA) caused hourly PM2.5 values to increase at EPD Monitoring stations
Summary Several meteorological tools (Trajectories, satellite imagery, synoptic conditions) could be utilized when characterizing exceptional events. In case of a tropopause fold, it is important to recognize the type of dynamic mechanism and to investigate total column ozone variability. This helps validate surface and low-level observations. Difficult to forecast, however, due to short duration and lack of upper air data. In fire/smoke activity, other meteorological factors could have contributed to enhanced particle pollution levels, such as approaching frontal systems and pre-frontal pooling. Easier to predict due to long duration and availability of surface data. Some exceptional events are more frequent and clear-cut than others, such as the Arabia fire/smoke case.
Acknowledgements • Amy K. Huff, Battelle Memorial Institute • Nyasha Dunkley, Georgia Environmental Protection Division • Sean Miller, Georgia Environmental Protection Division • Jim Renfro, National Park Service