Download
1 / 40
420 likes | 551 Views
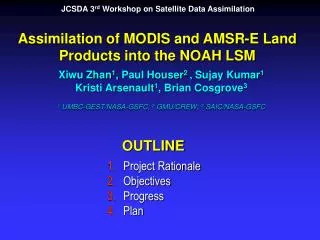
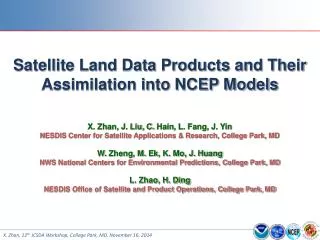
Satellite Land Data Products and Their Assimilation into NCEP Models. X. Zhan, J. Liu, C. Hain , L. Fang, J. Yin NESDIS Center for Satellite Applications & Research, College Park, MD W. Zheng , M. Ek , K. Mo, J. Huang NWS National Centers for Environmental Predictions, College Park, MD

E N D
Satellite Land Data Products and Their Assimilation into NCEP Models X. Zhan, J. Liu, C. Hain, L. Fang, J. Yin NESDIS Center for Satellite Applications & Research, College Park, MD W. Zheng, M. Ek, K. Mo, J. Huang NWS National Centers for Environmental Predictions, College Park, MD L. Zhao, H. Ding NESDIS Office of Satellite and Product Operations, College Park, MD
Outline • NCEP land data needs • NESDIS land satellite data availability • DA efforts at STAR with NCEP models • SMOPS and SM DA for NCEP NWP • GET-D for drought monitoring • Next steps
Outline • NCEP land data needs • NESDIS land satellite data availability • DA efforts at STAR with NCEP models • SMOPS and SM DA for NCEP NWP • GET-D for drought monitoring • Next steps
NOAA Model Production Suite Uccellini, 2009
Community Noah Land-Surface Model Uccellini, 2009
Outline • NCEP land data needs • NESDIS land satellite data availability • DA efforts at STAR with NCEP models • SMOPS and SM DA for NCEP NWP • GET-D for drought monitoring • Next steps
NESDIS Satellite Land Data Availability • NameSatellite/Sensor/SystemNRT Op • Sfc TypeAVHRR, MODIS, VIIRS, GOES/-RYes • Albedo AVHRR, MODIS, VIIRS, GOES/-R Yes • Fire AVHRR, MODIS, VIIRS, GOES/-R Yes • LST AVHRR, MODIS, VIIRS, GOES/-R Yes • NDVI/GVF AVHRR, MODIS, VIIRS, GOES/-R Yes • Sfc Emissivity MSPPS/MiRSYes • SM GOES/GOES-R, GCOM-W1, SMOPS Yes • Snow AutoSnow, MSPPS/MiRSYes • SWE AutoSnow, MSPPS/MiRSYes
Outline • NCEP land data needs • NESDIS land satellite data availability • DA efforts at STAR with NCEP models • SMOPS and SM DA for NCEP NWP • GET-D for drought monitoring • Next steps
DA Efforts@STAR with NCEP Models • NameSatellite/Sensor/SystemOp DA? • Sfc TypeAVHRR, MODIS, VIIRS, GOES/-RYes • Albedo AVHRR, MODIS, VIIRS, GOES/-R ? • Fire AVHRR, MODIS, VIIRS, GOES/-R Testing • LST AVHRR, MODIS, VIIRS, GOES/-R ? • NDVI/GVF AVHRR, MODIS, VIIRS, GOES/-R Tested • Sfc Emissivity MSPPS/MiRS? • SM GOES/GOES-R, GCOM-W1, SMOPS Tested • Snow AutoSnow, MSPPS/MiRSYes? • SWE AutoSnow, MSPPS/MiRSYes?
Outline • NCEP land data needs • NESDIS land satellite data availability • DA efforts at STAR with NCEP models • SMOPS and SM DA for NCEP NWP • GET-D for drought monitoring • Next steps
Satellite Soil Moisture Remote Sensing Science T a Microwave Sensitivity By Wavelength and Vegetation Density 4.0 Two ways to retrieve soil moisture from satellites: • Microwave (MW): Observed MW brightness temperature depends on soil dielectric constant that is related to soil moisture: • Strength: higher reliability based on direct physical relationships • Weakness: antenna technology limits spatial resolution • Thermal Infrared (TIR): Observed surface temperature changes result from surface energy balance that is dependent on soil moisture: • Strength: TIR sensor could have higher spatial resolution • Weakness: relies on land surface energy balance model that is prone to input data errors. 0 BARE 3.0 1 VEGETATION 2 WATER CONTENT (kg/m2) Sensitivity (Delta TB / Delta Vol SM) 2.0 4 1.0 0.0 0 5 10 15 20 25 Wavelength (cm) SSM/I AMSR /WindSat TMI SMOS / SMAP ABL T T a a H = H = H H + H + H c c s s R R a a Two-Source Model (ALEXI) H H c c T T ac ac T T c c R R x x H H R R s s soil soil T T s s TRAD fc 5 km 5 km
Microwave Soil Moisture Products from SMOPS • Increased spatial coverage • Multi retrieval variance could be used as error estimate
Microwave Soil Moisture Products from SMOPS ASCAT SMOS WindSat Blended
SM Data Assimilation Utility for NCEP GFS Courtesy of R. Reichle Noah GFS EnKF
Assimilation of MW SM into NCEP GFS Noah GFS EnKF Pros: GFS can demonstrate SM impact on forecasts GFS may take advantage of satellite SM obs earlier than full scale implementation Cons: Hardwiring limits more flexibility for assimilating other observational data
Assimilation of MW SM into NCEP GFS • Time: DA at 00z • from April 1 – May 5, 2012 • Data: SMOPS Blended Surface SM • Method: EnKF DA within GFS/GSI • Experiments: • CTL: Regular GFS run without SM DA • EnKF: Daily EnKF run
Comparison of soil moisture from SMOPS Blended 18Z, 1-30 April 2012 SMOPS GFS_CTL GFS_EnKF EnKF-CTL
Comparison of soil moisture from SMOPS Blended 18Z, 1-30 April 2012 SMOPS GFS_CTL EnKF-CTL GFS_EnKF
GFS Top Lay Soil Moisture Validation With USDA-SCAN Measurements 1-30 of April, 2012
700 hPa + 0.003 1000 hPa + 0.003
Outline • NCEP land data needs • NESDIS land satellite data availability • DA efforts at STAR with NCEP models • SMOPS and SM DA for NCEP NWP • GET-D for drought monitoring • Next steps
Thermal Infrared Remote Sensing for SM • Land surface temperature (LST) and solar insolation (Rs) from NOAA Geostationary Operational Environmental Satellite (GOES) imager and future GOES-R Advance Baseline Imager (ABI) are used in an Atmosphere-Land Exchange Inversion (ALEXI) model to generate ET and an Evaporative Stress Index (ESI) for drought monitoring. • ALEXI model output using GOES data have good agreement with field observations and full-scale land surface model simulations of ET. • ALEXI ET and ESI data products are being used at US operational drought monitoring.
ALEXI Drought Monitoring Webpage Used by USDA-ARS • ALEXI Evaporative Stress Index products generated at NESDIS STAR are currently being disseminated to end-users at NDMC and CPC through a website hosted by USDA-ARS (http://hrsl.arsusda.gov/drought/index.php). 27
GOES ET and Drought (GET-D) System ESPC Production Internet gp5 QC/VAL Linux Met Input GET-D Linux Intranet Sandia LST & Q ET & Drought Products GOES- Imager NCEP DDS CLASS NCEP & Other USERS LST & Q STAR Met Input GET-D Linux ET & Drought Products Internet Input Data: LST & solar insolation from GOES imagers, Met forcing from NCEP models via NLDAS 28
Current US Drought Monitoring Palmer Drought Index Vegetation Health Index LSM SM Output
Enhanced Drought Monitoring Palmer Drought Index Satellite ST, Alb, GVF/VI Vegetation Health Index LSM SM Output GOES/GOES-R ESI Satellite SM
Enhancing US Drought Monitoring with SNPP/JPPP Products • JPSS products to be used • Surface type (ST) & soil moisture (SM) • Albedo (Al) & Vegetation Index (VI) • Land surface temperature (LST) • Data assimilation approach • Direct insertion for JPSS ST, LST, Al and VI in NLDAS/GLDAS • EnKF for GCOM-W SM • Drought-monitoring products • Root-zone SM anomalies • NLDAS/GLDAS runs with and without assimilations • Evaluation • Root-zone SM simulations vs. in situobs • Drought monitoring products vs. standard drought indices and historical records Proposed drought information system
Impact of Sfc Type on LSM SM simulations In situ SM: Measurement for every 10 days from 2010-2011 LSM SM: Top 10cm layer simulations Correlation significance: black – no, blue – 0.05 credibility, green – 0.01, red – 0.001
Noah LSM v3.2 was used; • In situ SM data from about 50 SCAN sites were used; • SMOPS SM: SMOS, ASCAT, WindSat • OLP: no SM DA • DA01: SM DA for all GVF • DA02: SM DA for GVF < 0.7 • DA03: SM DA for GVF (ST) Impact of QC on GLDAS Soil Moisture DA Quality controlled SM data assimilation improved Noah LSM simulations
Data assimilation experiment matrix Impact of NRT GVF and albedo on Noah LSM SM Average improved percentage of SM simulations Between DA01- 05 and OLP over 2001 - 2011 Distributions of RMSE improvement for SM simulations bet’n DA05 and OLP over 2001-2011
Outline • NCEP land data needs • NESDIS land satellite data availability • DA efforts at STAR with NCEP models • SMOPS and SM DA for NCEP NWP • GET-D for drought monitoring • Next steps
GFS and LIS “Semi-Coupling” GFS Noah GFS Noah Forcing Forcing States States Noah Noah LIS LIS EnKF EnKF