Download
1 / 12
120 likes | 228 Views
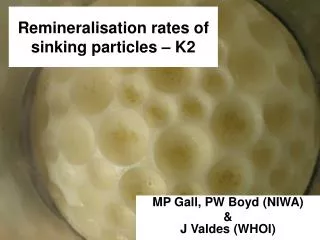
Remineralisation rates of sinking particles – K2. MP Gall, PW Boyd (NIWA) & J Valdes (WHOI). On VERTIGO we adopted 3 approaches to examining particle Remineralisation / Respiration. ii) In situ remineralisation of settling particles. ii) In situ respiration chambers.

E N D
Remineralisation rates of sinking particles – K2 MP Gall, PW Boyd (NIWA) &J Valdes (WHOI)
On VERTIGO we adopted 3 approaches to examining particle Remineralisation / Respiration ii) In situ remineralisation of settling particles ii) In situ respiration chambers • Shipboard Microwinkler • Incubations and ETS Successful A failure Data on ETS and bacterial ecto-enzymes before end of 2006 (HOT data indicate bact assim. effic. of 10% or less
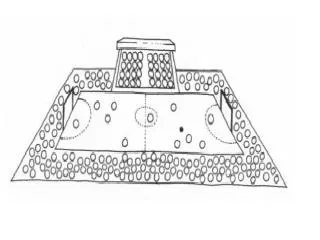
Methodology (i) A rotating ball design was employed to prevent swimmers entering the inner sanctum Our cylinder was deployed at 150 m depth along with other CLAP and ball trap cylinders A DO sensor was deployed within the ‘inner sanctum’ of the sediment trap
T=0 T=36 h T=72 h 10 min STOP DISSOLVED OXYGEN AND TEMPERATURE WAS MEASURED EVERY 10 MINUTES Fill trap with water from 200 m NO PRESERVATIVES
Particles collected on upper surface of the ball once it stopped turning
The experiments • Three 72 h deployments • 3 additional experiments • After deployment 3 the trap was placed in a temp • Controlled lab at atmospheric pressure and the • Remineralisation signature was followed for a further 36 h • ii) The video nasty – acclimated Neocalanus spp. • Were added to the water overlying the ball valve (which • Was coated with settled particles). Their behaviour was • Filmed – both with the ball in a stationary and in rotating • State. • iii) A serial addition experiment was conducted with • Neocalanus spp. – using microwinkler flasks to estimate • Their respiration rates
Turley (1993) DSR I “linear decrease in rates of Leucine and thymidine incorporation with increasing Pressure” at 200 atm rates were 1/3 to ½ of those at 1 atm
K2 234 Th flux In deployment 1 the 234 Th flux for the 36 h collection period was around 600 dpm m-2 d-1 Data courtesy of KEN BUESSELER
OXYGEN CONSUMPTION DUE TO PARTICLE REMINERALISATION 6.1 umol L-1 over 36 h Export flux (as O2) = 74.29 umol L-1 This equals 6.2/74.3 is 8% over 36 h
HOWEVER…… We recovered 9 copepods Neocalanus cristatus from the inner sanctum at the end of the deployment We set up a video of these animals at ambient temperature on the upper side of a ‘particle laden’ ball. It was clearly evident that they could ride the ball and access the innner sanctum
A FURTHER TRAP DEPLOYMENTS YIELDED COMPARABLE OXYGEN CONSUMPTION RATES – despite a marked decrease in Surface PP, EP, but not in b
WHAT DO THE DATA TELL US? Export flux (expressed as O2) = 74.29 umol L-1 over 36 h At 150 m So remineralisation equals 6.2/74.3 i.e. 8% over 36 h However, the particles that remineralised are a complex mixture of fast and slow sinkers (<10 m to 400 m d-1) Mixed layer 40 m 150 m Fast sinkers Could be 600 m deeper If it was not intercepted and remineralized in our trap