Download
1 / 36
360 likes | 460 Views
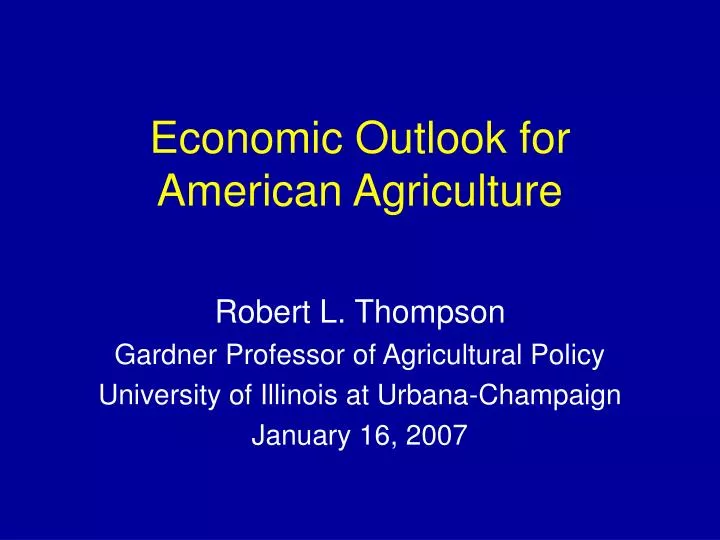
Economic Outlook for American Agriculture. Robert L. Thompson Gardner Professor of Agricultural Policy University of Illinois at Urbana-Champaign January 16, 2007. 2006 Farm Income. Total value of farm production $279.5 billion: crops up $7.1 billion livestock down $4.7 billion

E N D
Economic Outlook for American Agriculture Robert L. Thompson Gardner Professor of Agricultural Policy University of Illinois at Urbana-Champaign January 16, 2007
2006 Farm Income • Total value of farm production $279.5 billion: • crops up $7.1 billion • livestock down $4.7 billion • government payments down $7.8 billion • forestry & services up $1.7 billion • With input costs up $11 billion, net farm income down from $73 bil. in 2005 to $58.9 bil. in 2006. • Total direct government payments down from $24.3 billion in 2005 to $16.5 billion in 2006 • With rapid increase in land prices, farm sector equity increased 7% over 2005, with debt-to-asset & debt-to-equity ratios down. Source: ERS Jan. 12, 2007 report
Exports Are Critical to Ag Profitability • American agriculture exports the production of one out of three acres of cropland. These exports generate 1/4 of farm sales revenue. • In 2006 U.S. ag exports totaled $68 billion: • Grains & oilseeds $28.4 billion • Horticultural products $16.7 billion • Animal protein $13.2 billion • Cotton $ 4.9 billion • Most important markets: • Canada 18% • Mexico 16.5% • Japan 12% • China 11% • E.U. 10%
General Economy • Current economic expansion over 5 years old • Deceleration in 2nd half of 2006 due to declines in housing & motor vehicle sectors; the latter has worked inventories down, but not housing • Consumer spending holding up well despite negative wealth effect of housing slowdown • Drop in energy prices increased consumer purchasing power • Indices of consumer confidence rising • Business profits have been high, lifting stock prices & encouraging business expansion. • Unemployment rate lowest in 5 years; job creation strong; real wages rising
General Economy (contd) • “Soft landing” may be over & growth accelerating • “Core” inflation seems to be under control • But Fed will be cautious in changing discount rate • Risk of rise in energy & food prices • Strong economic growth in other countries, e.g. EU, Japan, China and India, providing strength to U.S. exports • Americans spending more than their incomes • Build-up of consumer debt worrisome with higher interest rates • 100% of the U.S. Government debt associated with Federal budget deficit is sold overseas, principally to governments of China and Japan • U.S. dollar sliding and likely will fall further
Ethanol Driving Ag Outlook • Ethanol industry growing rapidly with large subsidies, mandated use, tax exemptions, and protection from imports from lower-cost suppliers • This increased industrial demand for corn has resulted in higher prices; exports will fall. • Higher feed grains prices reducing profitability of U.S. livestock and poultry industries. • How long before we have technology for producing ethanol from cellulosic feedstocks? • Farmers and politicians are more enamored with growth in ethanol and other biofuels than with exports and WTO trade negotiations.
Growth in Ethanol Industry • 2000: 1.6 billion gallons of ethanol produced; used 6% of U.S. corn harvest • 2006: 5 billion gal.; used 20% of corn harvest • Now 110 ethanol plants are operating w/total capacity of 5.4 billion gal.; 73 more are under construction plus 8 more expanding • This will bring capacity to 11.4 billion gal. by 2008-09 • Energy Bill of 2005 mandated 7.5 billion gal. of biofuels by 2012
Corn & Feed Grains • Rapid growth in use in ethanol production has driven up price to record levels to bid corn away from exports and livestock & poultry feeding and to bid land away from soybeans, wheat, etc. in 2007. • U.S. corn exports may go to zero within a few years • Jan. 12 crop report reduced size of 2006 corn crop by 210 million bu. when supply-demand balance was already tight; implies stocks below pipeline level; drove corn price even higher, and took wheat and soybeans along with it. • How many mill. acres will corn pull from other crops? How fast can corn yields increase?
Soybeans & Oilseeds • Record 2006 U.S. soybean crop in 2006 • Strong export demand; China is importing half of world soybean trade • Growing use of soybean oil and other edible oils in biodiesel (rapid growth in Europe) will increase price of edible oils, raising value of oil fraction. • Meal fraction will confront competition from high protein ethanol byproduct, distillers dried grain, especially in ruminant feeding. • Soybean price will have to rise enough to stimulate expansion of South American soybean acreage to compensate for loss of U.S. soybean acreage to corn.
Livestock & Poultry • Huge uncertainty from rising price of feed • Likely severe drop in profitability of pork and poultry operations due to much higher feed costs • Beef & dairy feed costs will also rise, but to the extent that they can use significant amounts of ethanol byproduct (DDGS) in rations, they’ll be less severely impacted. • Expect higher meat prices to consumers as higher feed costs get passed through • Immigration reform essential to meat packing industry.
Exports Important to U.S. Meats • U.S. exports 13% of its pork production (16th consecutive record volume exported) • U.S. 2nd largest exporter after EU • Feed cost advantage; also weak dollar • U.S. poultry exports (12-15% of production) essential to profitability because U.S. exports largely dark meat (leg quarters) which have low value in U.S. domestic market • Some recovery in beef exports after devastating impact of BSE scare; shows need for a rules-based international trading system with tough SPS regulations grounded in sound science. • World price of feed will be everywhere higher. Net effect on U.S. competitiveness in meats?
Wheat • Sharp reduction in U.S. and world wheat production in 2006. (Australian drought) • U.S. winter wheat seeding increased, but will some be ripped out to plant corn? • Expect recovery of world wheat production in 2007. Will prices drop again after recovery, or will they have to stay high to keep land from moving from wheat into corn? • More drought-tolerant corn varieties are coming. • Will we see more wheat feeding than previously in the U.S.?
Dairy • Global demand for dairy products growing rapidly & world dairy prices at historic highs • Lower U.S. price of milk in 2006 • Large increases occurring in production per cow • Nat’l. ave. about to break through 20,000 lbs./cow/yr.! • Rapid growth of large, low unit cost of production herds that are internationally competitive (w/some geographic shifts to states with less onerous regulatory costs) • What future for small, high cost producers? • Whither MILC program?
Fruits & Vegetables • Growing demand from increased consumer health consciousness and 2005 revision of USDA Dietary Guidelines • Rapid increase in U.S. imports of fruits, vegetables, wine & beer has reduced ag trade balance almost to zero. • Consumers want diversity and 365-day per year availability in supermarkets. • Many U.S. export successes, but also keen competition from new exporters with lower labor costs, e.g. China • Immigration reform critical to future competitiveness • Food safety concerns after incidents in 2006
Cotton & Rice • Will high prices of corn and soybeans pull acres out of rice and/or cotton? • Profitability and ability to compete in export market more dependent on government support than other commodities (higher payments per acre and per farmer). • Will 2007 farm bill reduce this support? Will there be a buy-out or buy-down? • U.S. has not yet made all the changes mandated in WTO Brazil cotton decision. Rice program also vulnerable to challenge in WTO.
Changing World Ag Trade • Stagnant food demand in high income countries; rapid growth in developing countries as middle class grows • more through supermarkets (with global supply chain) • Larger percent of world production traded • Trade in high value & processed products growing faster than in commodities • Explosion of commodity exports from South America; expect more from Eastern Europe and Former USSR, esp. Ukraine
European Union • Shrinking population • Has as rapid growth of biodiesel as U.S. ethanol • Ag policy reforms underway are real • even sugar • Eliminating all export subsidies will force further reform of domestic ag policy • e.g. dairy (already planning to get rid of quotas) • Tough environmental and animal welfare regulations significantly raise costs • All battery cages to be banned from 2007 • Rejection of ag biotech setting back its competitiveness • Aggressive use of SPS barriers to ag imports
Eastern Europe & Former Soviet Union • Severely declining populations • Excellent soils in Ukraine and parts of FSU mean great ag productive potential • Weak applied research • Inadequate property rights (especially farm land), contact sanctity, & rule of law • Slow development of necessary ag input and product markets
East and South Asia • Huge population with large numbers of people at very low income levels mean huge future food demand growth • Has much larger percent of world’s population than arable land, so food demand likely to outrun supply potential
China • The 800-pound gorilla in all ag and mineral commodity markets today • Rapid economic growth has generated rapid growth in meat consumption, but half of population still earns less than $2/day. • Average farm size less than 1 acre leads to extensive rural poverty • To reduce rural poverty (and associated political stresses), government abandoned grain self-sufficiency objective; letting farmers grow labor-intensive higher value per acre crops; e.g. fruits, vegetables; animal agriculture. Exporting them. • Has largest number of pigs in world.
India • Projected to have 250 million more people than China by 2050. • Economy is starting to move; already 250 million middle-class consumers, but also 500 million living on less than $1 per day! • Huge dairy product consumption; has more dairy cows than any other country • Huge and growing poultry product consumption • Most people who don’t eat meat don’t by reason of poverty, not religion.
New Zealand & Australia • After New Zealand went cold turkey on ag subsidies, agriculture never more profitable nor more entrepreneurial • Reform also in Australia, but more gradual with buyouts • Dairy sectors of both have thrived; both have been extremely successful in penetrating Asian markets • Fonterra even markets US dairy products in world market • Neither is very big, so will never be marginal agricultural exporter (Australia has large land area, but most is desert.)
Canada • North-South integration of North American markets • NAFTA • Reform of rail freight rates • Dairy and poultry marketing quotas • Attracting sugar-using industries from U.S. • Canadian Wheat Board reform? • WTO case against U.S. corn program? • Revenue insurance programs possible model for US ag policy reform?
Middle East & North Africa • Can never be self-sufficient in food due to water scarcity • Israeli R&D “provides” state of the art technology in horticultural crops and efficient water use for entire Mediterranean Basin • Can only afford to use water on highest value crops • What future role of Mediterranean countries in world fruit and vegetable trade?
South America • One of only 2 regions with more land that can be brought into production • Brazilian agricultural export miracle • Soybeans & frozen concentrated orange juice • Now pork and broilers gaining fast • Key role of Brazil’s own ag research (EMBRAPA) • Argentina’s negative producer support (export taxation) • Brazil is world leader in ethanol to power automobiles (made from sugar cane) • How much shift into corn now likely?
Sub-Saharan Africa • Many countries are “basket cases” with declining per capita food production • Corruption & bad governance are main reasons for agriculture’s general underperformance • Underinvestment in rural infrastructure and education and agricultural research • There are a few success stories of global supply chains, e.g. vegetables & cut flowers to Europe • South Africa providing regional leadership • China active in Africa locking up access to both agricultural and mineral commodities • Could Southern Cone become the “next Brazil?”
Larger Fraction of World Food Production to Move Through Trade • The world’s arable land and fresh water are not distributed around in the world in the same proportions as population. • No way for Asia or Middle East to be self-sufficient in food • With population growth, urbanization and broad-based economic development, many LDCs’ food consumption to outstrip their production capacity and they will become larger net importers. • Efficient producers of feed grains and soybeans, wherever they are, will benefit significantly.
The World’s Arable Land (left)Is Distributed Very Differentlythan Its Population (right)
Projected World Food Demand • World food demand could double by 2050 • 50% increase from world population growth – all in developing countries • 50% increase possible if low income countries achieve broad-based economic growth • How many presently low income consumers are lifted out of poverty will be the most important determinant of the future size of world food and agricultural product markets. • The ability of low income countries to export the products in which they have a comparative advantage will constrain their ability to reduce poverty.
Projected Population Growth (U.N. medium projections) • Region 20052050 • World 6,465 9,076 + 40% • High Income 1,211 1,236 + 2% • Low Income 5,253 7,840 + 49% • Africa 906 1,937 +114% • Asia 3,905 5,217 + 33% • Latin America 561 783 + 40% • North America 331 438 + 32% • Europe 728 653 - 10%
Dynamics of World Food Demand • 1.25 billion people live on less than $1 per day, of whom 840 million suffer under-nutrition or hunger • 3 billion (almost half of the world’s population) live on less than $2 per day. • By $2 per day, most hunger (calorie) problem is solved • Between $2 and $10 per day people eat more animal protein, fruits, vegetables & edible oils, causing rapid growth in raw ag commodity demand • After $10 per day, people buy more processing, services, packaging, variety, and luxury forms, but not more raw ag commodities
Huge Market Growth Potential from Poverty Reduction Source: World Bank. World Development Indicators database
Doha Round Agricultural Agreement: What Is Possible? • Eliminate all forms of ag export subsidies • Reduce trade-distorting domestic subsidies (highest the most, but exceptions possible) • Reduce tariffs (highest the most, but exceptions allowed if increase minimum market access) • Accelerate economic growth in low income countries.
Prospects for Doha Round • U.S. farm organizations will support a Doha Round Agreement that significantly reduces trade-distorting domestic subsidies only if the Agreement includes significant increases in market access. • They put too much emphasis on increasing access into shrinking markets of the past and not enough on growing the total size of the world market. • Key sticking points: • Will the E.U. be able to offer more agricultural market access than heretofore? • Will the U.S. be able to increase its offer? • Will Brazil and India offer more market access for services and non-ag manufactured goods? • If not, the end of the Doha Round will not likely come during the Bush Presidency.
Remember • The Uruguay Round Agreement on Agriculture will continue to set the rules of the road for international agricultural trade until some future round of negotiations changes them. • If this round fails or is delayed, expect more cases to be filed with WTO against U.S. commodity programs. (No Peace Clause) • The U.S. risks losing marketing loans, LDPs and CCPs though litigation and get nothing for giving them up. If we give them up in the round, we get something for giving them up. • The round is not so much about reducing farm subsidies as it is about moving them from trade-distorting to non-trade-distorting mechanisms. • The big potential payoff is faster economic growth in LDCs and, in turn, larger world demand for ag products.