Download
1 / 19
190 likes | 289 Views
Testing Hypotheses about a Population Proportion. Lecture 30 Sections 9.3 Mon, Nov 15, 2004. Variations on the Method. Two variations on the method of testing a hypothesis. p -value approach Report the p -value and compare it to or let the reader decide for himself. Classical Approach

E N D
Testing Hypotheses about a Population Proportion Lecture 30 Sections 9.3 Mon, Nov 15, 2004
Variations on the Method • Two variations on the method of testing a hypothesis. • p-value approach • Report the p-value and compare it to or let the reader decide for himself. • Classical Approach • State . • Compute the critical value from and compare the test statistic to it.
Let’s Do It! • Let’s do it! 9.2, p. 529 – Improved Process? • Let’s do it! 9.3, p. 530 – ESP. • Let’s do it! 9.4, p. 531 – Working Part Time. • Article in the Journal of the American Medical Association.
JAMA Example • Results Compared with those without the metabolic syndrome (n = 1616), elders with the metabolic syndrome (n = 1016) were more likely to have cognitive impairment (26% vs 21%, multivariate adjusted relative risk [RR], 1.20; 95% confidence interval [CI], 1.02-1.41). There was a statistically significant interaction with inflammation and the metabolic syndrome (P = .03) on cognitive impairment. After stratifying for inflammation, those with the metabolic syndrome and high inflammation (n = 348) had an increased likelihood of cognitive impairment compared with those without the metabolic syndrome (multivariate adjusted RR, 1.66; 95% CI, 1.19-2.32). Those with the metabolic syndrome and low inflammation (n = 668) did not exhibit an increased likelihood of impairment (multivariate adjusted RR, 1.08; 95% CI, 0.89-1.30). Stratified multivariate random-effects models demonstrated that participants with the metabolic syndrome and high inflammation had greater 4-year decline on 3MS (P = .04) compared with those without the metabolic syndrome, whereas those with the metabolic syndrome and low inflammation did not (P = .44).
JAMA Example • Results Compared with those without the metabolic syndrome (n = 1616), elders with the metabolic syndrome (n = 1016) were more likely to have cognitive impairment (26% vs 21%, multivariate adjusted relative risk [RR], 1.20; 95% confidence interval [CI], 1.02-1.41). There was a statistically significant interaction with inflammation and the metabolic syndrome (P = .03) on cognitive impairment. After stratifying for inflammation, those with the metabolic syndrome and high inflammation (n = 348) had an increased likelihood of cognitive impairment compared with those without the metabolic syndrome (multivariate adjusted RR, 1.66; 95% CI, 1.19-2.32). Those with the metabolic syndrome and low inflammation (n = 668) did not exhibit an increased likelihood of impairment (multivariate adjusted RR, 1.08; 95% CI, 0.89-1.30). Stratified multivariate random-effects models demonstrated that participants with the metabolic syndrome and high inflammation had greater 4-year decline on 3MS (P = .04) compared with those without the metabolic syndrome, whereas those with the metabolic syndrome and low inflammation did not (P = .44).
JAMA Example • Results Compared with those without the metabolic syndrome (n = 1616), elders with the metabolic syndrome (n = 1016) were more likely to have cognitive impairment (26% vs 21%, multivariate adjusted relative risk [RR], 1.20; 95% confidence interval [CI], 1.02-1.41). There was a statistically significant interaction with inflammation and the metabolic syndrome (P = .03) on cognitive impairment. After stratifying for inflammation, those with the metabolic syndrome and high inflammation (n = 348) had an increased likelihood of cognitive impairment compared with those without the metabolic syndrome (multivariate adjusted RR, 1.66; 95% CI, 1.19-2.32). Those with the metabolic syndrome and low inflammation (n = 668) did not exhibit an increased likelihood of impairment (multivariate adjusted RR, 1.08; 95% CI, 0.89-1.30). Stratified multivariate random-effects models demonstrated that participants with the metabolic syndrome and high inflammation had greater 4-year decline on 3MS (P = .04) compared with those without the metabolic syndrome, whereas those with the metabolic syndrome and low inflammation did not (P = .44).
JAMA Example • Results Compared with those without the metabolic syndrome (n = 1616), elders with the metabolic syndrome (n = 1016) were more likely to have cognitive impairment (26% vs 21%, multivariate adjusted relative risk [RR], 1.20; 95% confidence interval [CI], 1.02-1.41). There was a statistically significant interaction with inflammation and the metabolic syndrome (P = .03) on cognitive impairment. After stratifying for inflammation, those with the metabolic syndrome and high inflammation (n = 348) had an increased likelihood of cognitive impairment compared with those without the metabolic syndrome (multivariate adjusted RR, 1.66; 95% CI, 1.19-2.32). Those with the metabolic syndrome and low inflammation (n = 668) did not exhibit an increased likelihood of impairment (multivariate adjusted RR, 1.08; 95% CI, 0.89-1.30). Stratified multivariate random-effects models demonstrated that participants with the metabolic syndrome and high inflammation had greater 4-year decline on 3MS (P = .04) compared with those without the metabolic syndrome, whereas those with the metabolic syndrome and low inflammation did not (P = .44).
JAMA Example • Results Compared with those without the metabolic syndrome (n = 1616), elders with the metabolic syndrome (n = 1016) were more likely to have cognitive impairment (26% vs 21%, multivariate adjusted relative risk [RR], 1.20; 95% confidence interval [CI], 1.02-1.41). There was a statistically significant interaction with inflammation and the metabolic syndrome (P = .03) on cognitive impairment. After stratifying for inflammation, those with the metabolic syndrome and high inflammation (n = 348) had an increased likelihood of cognitive impairment compared with those without the metabolic syndrome (multivariate adjusted RR, 1.66; 95% CI, 1.19-2.32). Those with the metabolic syndrome and low inflammation (n = 668) did not exhibit an increased likelihood of impairment (multivariate adjusted RR, 1.08; 95% CI, 0.89-1.30). Stratified multivariate random-effects models demonstrated that participants with the metabolic syndrome and high inflammation had greater 4-year decline on 3MS (P = .04) compared with those without the metabolic syndrome, whereas those with the metabolic syndrome and low inflammation did not (P = .44).
JAMA Example • Results Compared with those without the metabolic syndrome (n = 1616), elders with the metabolic syndrome (n = 1016) were more likely to have cognitive impairment (26% vs 21%, multivariate adjusted relative risk [RR], 1.20; 95% confidence interval [CI], 1.02-1.41). There was a statistically significant interaction with inflammation and the metabolic syndrome (P = .03) on cognitive impairment. After stratifying for inflammation, those with the metabolic syndrome and high inflammation (n = 348) had an increased likelihood of cognitive impairment compared with those without the metabolic syndrome (multivariate adjusted RR, 1.66; 95% CI, 1.19-2.32). Those with the metabolic syndrome and low inflammation (n = 668) did not exhibit an increased likelihood of impairment (multivariate adjusted RR, 1.08; 95% CI, 0.89-1.30). Stratified multivariate random-effects models demonstrated that participants with the metabolic syndrome and high inflammation had greater 4-year decline on 3MS (P = .04) compared with those without the metabolic syndrome, whereas those with the metabolic syndrome and low inflammation did not (P = .44).
JAMA Example • Results Compared with those without the metabolic syndrome (n = 1616), elders with the metabolic syndrome (n = 1016) were more likely to have cognitive impairment (26% vs 21%, multivariate adjusted relative risk [RR], 1.20; 95% confidence interval [CI], 1.02-1.41). There was a statistically significant interaction with inflammation and the metabolic syndrome (P = .03) on cognitive impairment. After stratifying for inflammation, those with the metabolic syndrome and high inflammation (n = 348) had an increased likelihood of cognitive impairment compared with those without the metabolic syndrome (multivariate adjusted RR, 1.66; 95% CI, 1.19-2.32). Those with the metabolic syndrome and low inflammation (n = 668) did not exhibit an increased likelihood of impairment (multivariate adjusted RR, 1.08; 95% CI, 0.89-1.30). Stratified multivariate random-effects models demonstrated that participants with the metabolic syndrome and high inflammation had greater 4-year decline on 3MS (P = .04) compared with those without the metabolic syndrome, whereas those with the metabolic syndrome and low inflammation did not (P = .44).
JAMA Example • Results Compared with those without the metabolic syndrome (n = 1616), elders with the metabolic syndrome (n = 1016) weremore likelyto have cognitive impairment (26% vs 21%, multivariate adjusted relative risk [RR], 1.20; 95% confidence interval [CI], 1.02-1.41). There was a statistically significant interaction with inflammation and the metabolic syndrome (P = .03) on cognitive impairment. After stratifying for inflammation, those with the metabolic syndrome and high inflammation (n = 348) had anincreased likelihoodof cognitive impairmentcompared with those without the metabolic syndrome (multivariate adjusted RR, 1.66; 95% CI, 1.19-2.32). Those with the metabolic syndrome and low inflammation (n = 668) did not exhibit anincreased likelihoodof impairment (multivariate adjusted RR, 1.08; 95% CI, 0.89-1.30). Stratified multivariate random-effects models demonstrated that participants with the metabolic syndrome and high inflammation had greater 4-year decline on 3MS (P = .04) compared with those without the metabolic syndrome, whereasthose with the metabolic syndrome and low inflammation did not (P = .44).
The Classical Approach • 1. State the hypotheses. • 2. State the level of significance. • 3. Find the critical value of the test statistic and the rejection region. • 4. State the decision rule. • 5. Compute the value of the test statistic. • 6. State the conclusion.
The Classical Approach • 1. State the hypotheses. • 2. State the level of significance. • 3. Find the critical value of the test statistic and the rejection region. • 4. State the decision rule. • 5. Compute the value of the test statistic. • 6. State the conclusion.
Step 3: The Critical Value and the Rejection Region • In a one-tailed test, the critical valuec is the value of the test statistic that cuts off a tail of area in the direction of extreme. • Rejection region – the interval that starts at c and goes in the direction of extreme. z p0 c
The Critical Value and the Rejection Region • In a one-tailed test, the critical valuec is the value of the test statistic that cuts off a tail of area in the direction of extreme. • Rejection region – the interval that starts at c and goes in the direction of extreme. Rejection region z p0 c
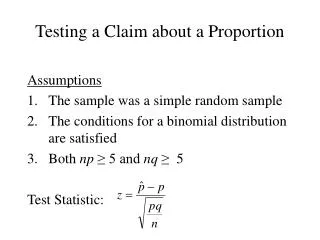
The Critical Value and the Rejection Region • In a two-tailed test, the critical valuec is the value that cuts off an upper tail of area /2. • The rejection region is the two intervals that start at c and go in the directions of extreme. z –c p0 c
The Critical Value and the Rejection Region • In a two-tailed test, the critical valuec is the value that cuts off an upper tail of area /2. • The rejection region is the two intervals that start at c and go in the directions of extreme. /2 /2 Rejection region Rejection region z –c p0 c
Step 4: The Decision Rule • Decision rule – A statement that exactly which values of the test statistic will lead to reject H0. • One-tailed test, extreme to the right. • Reject H0 if z > c. • One-tailed test, extreme to the left. • Reject H0 if z < c. • Two-tailed test. • Reject H0 if either z > c or z < –c.
Example • Rework the example of the 520 male births out of 1000 births using the classical approach.