Download

1 / 32
320 likes | 523 Views
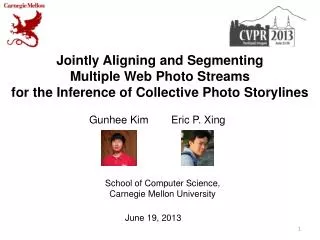
Joint Summarization of Large-scale Collections of Web Images and Videos for Storyline Reconstruction. Gunhee Kim Leonid Sigal Eric P. Xing. June 16, 2014. Outline. Problem Statement Algorithm Video summarization Storyline reconstruction Experiments Conclusion.

E N D
Joint Summarization of Large-scale Collections of Web Images and Videos for Storyline Reconstruction Gunhee Kim Leonid Sigal Eric P. Xing June 16, 2014
Outline • Problem Statement • Algorithm • Video summarization • Storyline reconstruction • Experiments • Conclusion
Background Online photo/video sharing becomes so popular Information overload problem in visual data Average 3,000 pictures uploaded per minute Any efficient and comprehensive summary? 100 hours of video are uploaded per minute
Our Objective Jointly summarize large sets of online imagesand videos • The characteristics of two media are complementary Collections of Images Videosummarization Videos: Much redundant and noisy information Images: More carefully taken from canonical viewpoints full of trivial BG overexposure backlit subjects A set of photo streams A user video
Our Objective Jointly summarize large sets of online imagesand videos • The characteristics of two media are complementary Image summarization Collections of Videos Images: Sequential structure is often missing Videos: Motion pictures A photo stream A set of user videos
Problem Statement (Input) A set of photo streams and user videos for a topic of interest (Output1) Video summary: keyframe-based summarization (Output2) Image summary asStoryline graph • Vertices: dominant image clusters • Edges: chronological or causal relations (i.e., recur in many photo streams)
Flickr and YouTube Dataset 20 outdoor recreational classes • # images/photo streams (2,769,504, 35,545) • # videos (15,912) LondonMarathon HorseRiding SurfingBeach ChineseNew year RAfting St.PatrickDay ScubaDiving MemorialDay SNowboarding Air Ball-ooning Independ-enceDay MountainCamping FormulaOne YAcht ROwing RockClimbing SafariPark Tour deFrance Wimble-don FlyFishing
Outline • Problem Statement • Algorithm • Video summarization • Storyline reconstruction • Experiments • Conclusion
Algorithm for Video Summarization 1. For each video , find the K-nearest photo streams • Extreme diversity even with the same keywords • Use Naïve-Bayes Nearest Neighbor method 2. Build a similarity graph between video frames and images A set of photo streams A user video
Algorithm for Video Summarization 1. For each video , find the K-nearest photo streams • Extreme diversity even with the same keywords • Use Naïve-Bayes Nearest Neighbor method 2. Build a similarity graph between video frames and images • k-th order Markov chain between frames • Each image casts m similarity votes A set of photo streams A user videos
Algorithm for Video Summarization 3. Solve the following optimization problem of diversity ranking Submodular A simply greedy achieves a constant factor approximation [Kim et al. ICCV 2011] • Choose the nodes to place heat source to maximize the temperature • Sources should be (i) densely connected nodes, (ii) distant one another. A set of photo streams A user videos
Outline • Problem Statement • Algorithm • Video summarization • Image summarization (Storyline reconstruction) • Experiments • Conclusion
Definition of Storyline Graphs A storyline graph • : the vertex set = the set of codewords (i.e. image clusters) • Images are too many, and much of them are largely redundant • : popular transitions recurring across many photo streams Edges should be Sparseand Time-varying[Song et al. 09, Kolar et al.10] Sparsity : only a small number of branching stories per node • A few nonzero elements in
Definition of Storyline Graphs A storyline graph • : the vertex set = the set of codewords (i.e. image clusters) • Images are too many, and much of them are largely redundant • : popular transitions recurring across many photo streams Edges should be Sparseand Time-varying[Song et al. 09, Kolar et al.10] Time-varying: popular transitions change over time Cluster 10 25 At 1PM 44 timeline t = 12PM t = 10AM t = 2PM At 7PM
Directed Tree Derived from Photo Stream 1. For each photo stream , find the K-nearest videos • Use Naïve-Bayes Nearest Neighbor method 2. k-th order Markov chain btw images in a photo stream 3. Keyframe detection for each neighbor video 4. Additional links are connected based on one-to-one correspondences
Directed Tree Derived from Photo Stream 5. Replace the vee structure (impractical artifact) by two parallel edges ✗ • Both and must occur in order for to appear. • and are followed by .
Inferring Photo Storyline Graphs (1/3) Input: A set of photo streams Output : A set of adjacency matrices for (A1) All photo streams are taken independently (A2) k-th order Markovian assumption btw consecutive images in PS (ex. k=1) Objective: Derive the likelihood of an observed set of photo streams with reasonable assumptions Transition model Likelihood of a single photo stream (A3) The codewordsof xli are conditional independent one another given xli-1
Inferring Photo Storyline Graphs (2/3) where For transition model, use a linear dynamic model • 1st order Markovian assumption Gaussian noise • k-th order Markovian assumption where Objective: Derive the likelihood of an observed set of photo streams with reasonable assumptions Transition model A transition from x to y is very unlikely!
Inferring Photo Storyline Graphs (3/3) where For transition model, use a linear dynamic model • 1st order Markovian assumption Gaussian noise • The transition model per dimension can be where Objective: Derive the likelihood of an observed set of photo streams with reasonable assumptions Transition model The log likelihood d-th row
Optimization (1/2) For each t , estimate At by maximizing the log-likelihood Optimization • (A4) Graphs vary smoothly over time. Gaussian Kernel weighting Timeline Data (i.e. images)
Optimization (2/2) In summary, the graph inference is where Iteratively solve a weighted L1-regularized least square problem • Linear-time algorithm (eg. Coordinate descent) • Trivially parallelizable (for each d) • Important in our problem (i.e. handling millions of images). Sparsity
Outline • Problem Statement • Algorithm • Video summarization • Storyline reconstruction • Experiments • Conclusion
Evaluation of Video Summarization via AMT Groundtruths for video summarication via Amazon Mechanical Turk • (1) For each of 100 test videos, each algorithm selects Kkeyframes • (2) At least five turkers are asked to choose GT keyframes • (3) Compare between GT keyframes and ones chosen by the algorithm (OursV): our method with videos only. (OursIV): our method with videos and images (Unif): uniform sampling. (Spect),(Kmeans): Spectral clustering/Kmeans (RankT): Keyframeextraction methods using the rank-tracing technique
Comparison of Video Summarization AMT (OursIV) (Unif): cannot correctly handle different lengths of subshots (Kmean): hard to know best K (OursV): suffer from the limitations of using low-level features only (OursV) (OursIV): Get help from the voting by more carefully taken images (Kmean) (Unif) air+ballooning fly+fishing
Evaluation on Storyline Graphs via AMT Main difficulty of quantitative evaluation • No groudtruth available. • For a human subject, images and too many and graphs are too big Ex) fly+fishing Which is better? Crowdsourcing-based evaluation via
Evaluation on Storyline Graphs via AMT 1. Each algorithm creates storyline per topic. 2. Sample 100 important images as test images 3. Each algorithm predicts next most-likely image after the test image 4. A pairwise preference test • Given the test image, which of A and B is more likely to come next? • Get responses from at least 3 turkers per test image Test image A A crowd of human subjects evaluate only a basic unit (i.e. important edges of storyline). Baseline 2 ✔ B Our method
Quantitative of Storyline Graphs via AMT Results of pairwise preference tests (OursV): our method with videos only. (OursIV): our method with videos and images NET: Network-based topic models ([Kim et al. 2008]) HMM: Hidden Markov Models Page: PageRank based image retrieval (no structural info) • The numbers indicates the percentage of responses that our prediction is more likely to occur next. • At least the number should be higher than 50% to validate the superiority of our algorithm.
Qualitative Evaluation on Storyline Graphs Given a pair of images in a novel photo stream, predict 10 images that are likely to occur between them using its storyline graph GT Ours (HMM) (PageRank) • (HMM) retrieves reasonably good but highly redundant images. No branching structure. • (PageRank) retrieves high-quality images but no sequential structure.
Qualitative Evaluation on Storyline Graphs Given a pair of images in a novel photo stream, predict 10 images that are likely to occur between them using its storyline graph GT Ours A downsized storyline graph
Outline • Problem Statement • Algorithm • Video summarization • Storyline reconstruction • Experiments • Conclusion
Conclusion Joint summarization of Flickr images and YouTube videos • The characteristics of two media are complementary Semantic summary even with simple feature similarity Structural summary with branching narratives Images: More carefully taken from canonical viewpoints Videos: Motion pictures Inference algorithm for sparse time-varying directed graphs • Global optimality, linear complexity, and easy parallelization • 2.7M Flickr images and 17K YouTube videos for 20 classes