Download
1 / 38
380 likes | 465 Views
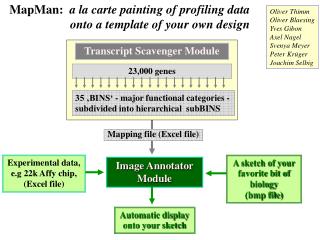
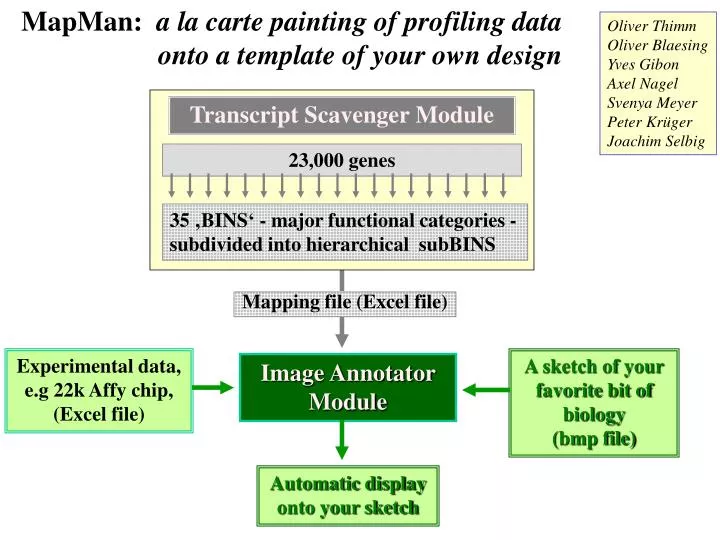
MapMan: a la carte painting of profiling data onto a template of your own design. Transcript Scavenger Module. 23,000 genes. 35 ‚BINS‘ - major functional categories - subdivided into hierarchical subBINS. Mapping file (Excel file). A sketch of your favorite bit of biology (bmp file).

E N D
MapMan: a la carte painting of profiling data onto a template of your own design Transcript Scavenger Module 23,000 genes 35 ‚BINS‘ - major functional categories- subdivided into hierarchical subBINS Mapping file (Excel file) A sketch of your favorite bit of biology (bmp file) Experimental data, e.g 22k Affy chip, (Excel file) Automatic display onto your sketch Oliver Thimm Oliver Blaesing Yves Gibon Axel Nagel Svenya Meyer Peter Krüger Joachim Selbig Image Annotator Module
1310 entries Assignment to BINS 2812 entries - Screen Tigr3 gene descriptions with text search algorithms using Kegg enzyme and alternative names 3080 entries Assignment toBINS 16213 entries keywords user defined keywords - Manual correction of binned gene annotations 21918 entries 19584 unique master file Manually corrected file - Import existing categorised genes Sorting genes into (rubbish) BINS, with the SCAVENGER module
A mouse over action revealss the assignment, illustrated for 249804_at (encodes galactinol synthase, as is displayed at the bottom of the screen) Excerpt from a mapping file BIN 3 is expanded to show its sub-BINS Sub-BIN 3.1 (raffinose metabolism) is expanded to the level of single genes. - identified by a ‚unique identifier (Affy number blablablablabla_at) - will carry the numeric code ‚3.1‘ The mapping file (i)Re-organises the experimental data file. - Groups together all the genes that have a particular numeric code (i.e., are in the same BIN/sub-BIN). (ii)Provides the code via which the resulting sets of data are painted onto your pretty diagrams
Mouse click at a selected position on the picture Frequency histogramm presentation default : shows each gene Mouse over The User takes a diagram of his/her choice, and decides what data is displayed, where, and how .... What data do you want to paint here ? Data files Type in BIN identifier maps + Mapping files Blue = increase Red = decrease Grey = no call White = no change How do you want to show it ?
Syn- thesis Break- down Ascorbate, Glutathione Misc. kin-ases Myo-Ins Callose. Sugar alcohol Misc Treh-alose Raffi-nose Pectin-esterases Break- down Syn- thesis UDP-sugar metabolism Calvin cycle Cellulose and hemicellulose synthesis Pectin lyases, polygalacturonases Hemi-cellose Cellu-lases XETs, Expansins Photo-respiration Cell wall breakdown gluconeogenesis FA synthesis Fermentation Desaturation Phospho- and galacto- lipids TAG Glyoxalate cycle beta oxidation (lyso)phos pholipases GDSL lipisaes lipases Other organic acid trans-formations Sterols and sulpholipid Lipid breakdown Carbonic anhydrases Tetrapyrrole Branched chain amino acid AT GABA metabolism Ammonium assimilation Nitrate reduction Asp AT Ala AT Asn Ammonium release Ser Val Phe His Thr Asn Leu Pro Ser Phe Val Tyr His Gly Ileu Pro Thr Tryp Gly Tyr C-1 metabolism Met Arg Cys Arg Ileu Tryp Cys Salvage Lys Leu Hyp Hyp Synthesis Breakdown Deoxy-nucleotide Met Chorismate synthesis Homoserine synthesis Lys Phosphotransfer pyrophosphases Amino acid synthesis Amino acid breakdown Nucleotides Example of a ‚map‘ Glycolysis Mitochondrial electron transport and ATP synthesis
4h, 6h, and 8h Extension of the night for 2h, Transcripts
Pectin *esterases Selective changes of expression of genes involved in cell wall synthesis, breakdown and modification synthesis pectin lyases polygalacturonases XET‘s Expansins Break down Transcripts
Painting at the pathway level 2h ext night 2 h into the extended night A few genes induced No genes repressed
Induction of two PFP family members and cytosolic FBPase Tho‘ many genes for pyruvate kinases are slightly repressed, one is induced 4h ext night 4 h into the extended night Some genes for glycolytic enzymes are being repressed
Reciprocal changes of specific PFK/PFP and FBP family members Many genes for pyruvate kinases are slightly repressed, but three are is induced 6h ext night 6 h into the extended night Some genes for glycolytic enzymes are being repressed
Reciprocal changes of specific PFK/PFP and FBP family members Many genes for pyruvate kinases are slightly repressed, but one is induced 8h ext night 8 h into the extended night - Repression becomes stronger and spreads to more genes
Looking for changes in general functions 4h, 6h, and 8h Cellular functions in an extended night after 2h,
Sugars regulate expression of 100’s of genes Nucleotide metabolism 23.1 Synthesis 23.2 Breakdown 11.4 Phospho- & galactolipid synthesis 11.2 FA desaturation 11.1 FA synthesis Lipid metabolism 11.9.2 Lipases 11.9.3 (lyso)-phos- pholipases 11.9.4 ß-oxidation 10.5 Pectin *esterases 10.2 + 10.3 Cellulose & hemicellulose synthesis 10.6.2 Matrix breakdown Cell wall 10.7 XET‘s Expansins 10.6.3 Pectin lyases Polygalacturonases • - Central carbon metabolism • Nitrate, ammonium, amino acid • and nucleotide metabolism • RNA and protein synthesis • - Lipid metabolism • Cell wall metabolism and • modification • - Secondary metabolism • Hormone synthesis and sensing • Signalling pathways • Transcription factors
Integration with further experiments - comparison with other nutrient challenges Overlay plots Arabidopsis grown in liquid culture under continuous light with full nutrients, or with one limiting ... Treatments: Resupply 3mM sucrose to sugar-depleted seedlings. Resupply 3mM nitrate to nitrate-depleted seedlings. Resupply 3mM phosphate to phosphate-depleted seedlings Resupply 3mM sulphate to sulphate-depleted seedlings
6h Extended night vs. End of normal night pgm at end of night vs. WT at end of night in pgm vs. in Extended Night Paint out the result for each individual gene onto the map Increase by > 1.0 in both Increase by > 0.5 in both Change by < 0.5 in both Decrease by > 0.5 in both Decrease by > 1.0 in both Opposing Responses Overlay the responses to identify similarities and differences on a gene-to-gene basis Mathematical correlation plot for all the genes
Light harvesting proteins etc. Direct overlay of the responses: 6h extended night vs. pgm
Many non-shared responses Overlay plot comparing the response of metabolism tocarbon and nitratedeficiency Shared: Repress - Pectinesterases - Expansins, - XET‘s - PolyGalUAases Shared: Induce many genes for amino acid breakdown
Repression of photosynthesis Repression of chlorophyll synthesis Many shared responses Overlay plot comparing the response of metabolism tonitrate and phosphatedeficiency Induction of phenylpropanoid and flavanoid metabolism
Many shared responses Overlay plot comparing the response of metabolism tonitrate and sulphatedeficiency Repression of photosynthesis Repression of chlorophyll synthesis Induction of phenylpropanoid and flavanoid metabolism
Current Work Ongoing correction of assignments by mining public sites Establish pipelines to import updates of annotation, and expert advice Display clusters or other statistictically-generated groupings of genes Visualisation of metabolite profiling data sets Combination of data-sets at different levels Statistical treatment of the responses of different BINS - rigorous support for conclusions - data condensation to aid compariosn of different treatments - support automatic identification of co-regulated processes Adapt display to give information about the expression level as well as the change of expression Extend to visualise the expression of a small set of genes-of-interest across a large collection of arrays for different developmental stages, organs , or treatments. Use to organise and display data sets from crop plants
pgm PCA Analysis of transcript profiles:- diurnal cycles in wildtype (biological triplicates) - extended night in wildtype (biological duplicates) - diurnal cycles in pgm (biological duplicates) WildtypeDark Wildtype Extended night Wildtype Light Component 1: treatments lie on an axis from high to low sugar total of 40 arrays in 20 conditions
Response of starved seedlings to added sugar: starved of sugar 3hrs after adding sugar Weighting in the 1st component, in PCA of diurnal rhythms and extended night treatments Correlation plot for ~14,000 genes betweenWeightingsoftranscripts in the first principle component andChanges of transcripts in the first 3 hrs after adding sugar to sugar-starved seedlings in liquid culture
Several cell wall degradingenzymes Several cell wall degradingenzymes Several TPS‘s Several TPS‘s SO4 assimi-lation SO4 assimi-lation Phenyl-propanoid and flavonoid metabolism Phenyl-propanoid and flavonoid metabolism ASN1 ASN1 Amino acid break-down Amino acid break-down GDH1 GDH2 GDH1 GDH2 Amino acid synthesis Amino acid synthesis 1st component for diurnal changes and extended night Changes after adding sugar to starved seedlings Reciprocal plot
MapMan: a la carte painting of profiling data onto a template of your own design Transcript Scavenger Module Metabolite Scavenger Module 23,000 genes 100‘s of metabolites 35 ‚BINS‘ - major functional categories- subdivided into hierarchical subBINS 35 ‚BINS‘ - major functional categories- subdivided into hierarchical subBINS Mapping file A sketch of your favorite bit of biology –bmp file Experimental data, e.g 22k Affy array, as an Excel file Experimental data, e.g GC-MS profile, as an Excel file Automatic display onto your sketch Oliver Thimm Oliver Blaesing Yves Gibon Axel Nagel Svenya Meyer Peter Krüger Joachim Selbig Image Annotator Module
L. penelli metabolite profile painted out with Mapman In work Changes are shown in false color relative to L. esculentum
An introgression line with improved nitrogen assimilation .... In work Changes are shown in false color relative to L. esculentum
An introgression line with improved amino acid biosynthesis.... In work Changes are shown in false color relative to L. esculentum
An introgression line with high levels of stress-related metabolites In work Changes are shown in false color relative to L. esculentum
Induce glycolysis and the TCA cycle 30 min Induce sucrose breakdown Induce OPP cycle Reprogrammning of metabolism after adding nitrate back to deficient seedlings in liquid culture Induce nitrate reduction
Repress enzymes for gluconeogenesis Induce specific members of the families for each enzyme needed to move carbon from the end of glycolysis through to 2-oxoglutarate –the acceptor for ammonium TCA cycle Repress non-phosphory-lating NADH dehydrogenases Mitochondrial electron transport & ATP synthesis Responses can be resolved to the pathway level
Induce glycolysis and the TCA cycle Inhibition ofphenylpropanoid and flavonoid metabolism Inhibit amino acid and nucleotide breakdown 3 hours 30 min Induce sucrose breakdown Induce OPP cycle Induce several XET‘s and expansins Induce several FA desaturases Reprogrammning of metabolism after adding nitrate back to deficient seedlings in liquid culture Induce photosynthesis Why is Phe synthesis inhibited Induce nitrate reduction Induce sulphate reduction Induce nucleotide synthesis and salvage Induce amino acid synthesis
Nitrate readdition leads to major changes of transcripts for large enzyme families involved in biosynthetic and secondary metabolism after 30 min, 3 hours and 2 days Many glucosyltransferases are repressed Very widespread changes
... and 3 hours Cellular responses to nitrate resupply .. after 30 min