
Reading Crypto Charts A Comprehensive Guide
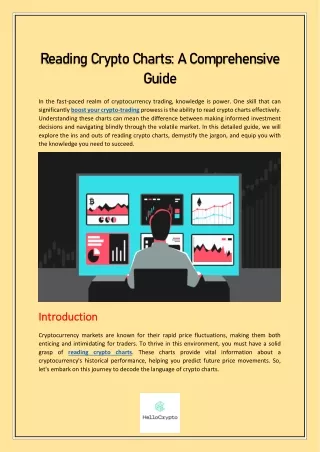
Cryptocurrency markets are known for their rapid price fluctuations, making them both enticing and intimidating for traders. To thrive in this environment, you must have a solid grasp of reading crypto charts. These charts provide vital information about a cryptocurrency's historical performance, helping you predict future price movements. So, let's embark on this journey to decode the language of crypto charts.<br>

Reading Crypto Charts A Comprehensive Guide
E N D
Presentation Transcript
Reading Crypto Charts: A Comprehensive Guide In the fast-paced realm of cryptocurrency trading, knowledge is power. One skill that can significantly boost your crypto-trading prowess is the ability to read crypto charts effectively. Understanding these charts can mean the difference between making informed investment decisions and navigating blindly through the volatile market. In this detailed guide, we will explore the ins and outs of reading crypto charts, demystify the jargon, and equip you with the knowledge you need to succeed. Introduction Introduction Cryptocurrency markets are known for their rapid price fluctuations, making them both enticing and intimidating for traders. To thrive in this environment, you must have a solid grasp of reading crypto charts. These charts provide vital information about a cryptocurrency's historical performance, helping you predict future price movements. So, let's embark on this journey to decode the language of crypto charts.
Understanding Crypto Chart Basics Understanding Crypto Chart Basics What Are Crypto Charts? Crypto charts, short for cryptocurrency charts, are graphical representations of a cryptocurrency's price movements over time. They display price data in various timeframes, such as minutes, hours, days, or even years, depending on your preference. Types of Crypto Charts oLine Charts: Line charts are straightforward and easy to interpret, making them suitable for quick analysis of a cryptocurrency's price history. They connect the closing prices with a continuous line, allowing traders to identify general trends such as upward or downward movements. oCandlestick Charts: Candlestick charts offer a wealth of information to traders. Each candlestick represents a specific time interval, and they provide insights into price volatility and market sentiment. The body of the candlestick represents the opening and closing prices, with different colors indicating whether the price increased (bullish, often green) or decreased (bearish, often red) during that interval. oOHLC Charts: Open, High, Low, Close (OHLC) charts provide a comprehensive view of price action during a specific timeframe. OHLC charts are similar to candlestick charts in that they provide a comprehensive view of price action over a specified timeframe. However, they break down each interval into four data points: Open, High, Low, and Close. The opening price is represented by a horizontal line to the left of the vertical line segment, the high and low are indicated by lines extending above and below the
vertical line, and the closing price is represented by a horizontal line to the right of the vertical line Reading Timeframes Different timeframes suit different trading strategies. Short-term traders may focus on minute or hourly charts, while long-term investors may prefer daily or weekly charts. Understanding your trading style is crucial in selecting the right timeframe. Interpreting Crypto Chart Patterns Interpreting Crypto Chart Patterns Support and Resistance Levels Support and resistance levels are crucial in technical analysis as they provide insights into market psychology. Support levels act like safety nets, showing where traders believe the cryptocurrency's price is a good buy, and this can lead to increased buying activity, preventing further declines. Resistance levels, conversely, act as barriers, indicating where traders tend to see the cryptocurrency as overvalued, leading to selling pressure and hindering price growth. Trendlines Trendlines are dynamic tools that help traders gauge the strength and stability of a cryptocurrency's price movement. An ascending trendline suggests that the market sentiment is optimistic, with higher lows indicating a bullish trend. Conversely, a descending trendline reflects pessimism, with lower highs signalling a bearish trend, allowing traders to make informed decisions based on market direction. Moving Averages Moving averages are indispensable indicators for traders, offering a smooth representation of price trends. The Simple Moving Average (SMA) calculates the average price over a specific period, providing a clear and simple trend signal. In contrast, the Exponential Moving Average (EMA) gives more weight to recent prices, making it responsive to recent market shifts, which can help traders identify changing trends more quickly. By utilizing these moving averages, traders can make informed decisions based on historical price data, improving their chances of success in the cryptocurrency market. Reading Crypto Chart Indicator Reading Crypto Chart Indicators s Relative Strength Index (RSI) The RSI is a widely used momentum oscillator that helps traders and investors gauge the strength of a price trend. When the RSI is above 70, it suggests that the asset may be
overvalued and due for a potential pullback or correction. Conversely, when the RSI drops below 30, it indicates that the asset may be oversold, which could signal a possible rebound in its price. Traders often use RSI to identify divergence between price and momentum, which can be a strong indicator of potential trend reversals. Moving Average Convergence Divergence (MACD) The MACD is a versatile and popular technical indicator that combines two moving averages, typically a short-term and a long-term one. It helps traders identify shifts in momentum, as well as potential buy and sell signals. When the MACD line crosses above the signal line, it generates a bullish signal, suggesting a potential uptrend. Conversely, when the MACD line crosses below the signal line, it generates a bearish signal, indicating a possible downtrend. Traders also look for divergence between the MACD and the price chart to spot potential trend reversals or weakness in the current trend. Bollinger Bands Bollinger Bands are a volatility indicator that consists of three lines: a middle line representing a simple moving average (usually 20 periods) and two outer bands that are standard deviations away from the middle line. These bands help traders assess the potential volatility and price reversals in an asset. When the Bollinger Bands contract or squeeze together, it suggests that volatility is low, and this often precedes a significant price move. Conversely, when the bands widen, it indicates increasing volatility and the potential for a price trend to continue or reverse. Traders use Bollinger Bands in conjunction with other technical indicators to make informed trading decisions.
Frequently Asked Questions Frequently Asked Questions How can I choose the right time for my trading strategy? Select a time that sets with your trading goals. Short-term traders may opt for shorter timeframes, while long-term investors should focus on longer ones. What are the main key differences between SMA and EMA? While both are moving averages, SMA gives equal weight to all data points, whereas EMA assigns more weight to recent prices, making it more responsive to current market conditions. Can I completely depend on crypto charts for trading decisions? Crypto charts are a valuable tool, but it's essential to consider other factors like news, market sentiment, and fundamental analysis when making trading decisions. How can I stay updated with the latest crypto chart patterns? To stay informed, follow reputable cryptocurrency news sources, and consider joining online communities where traders discuss market trends.
Are there any free resources for learning more about reading crypto charts? Yes, there are numerous online tutorials, forums, and educational websites that offer valuable insights into reading crypto charts. Is it possible to predict crypto prices accurately with charts alone? While charts provide valuable information, crypto markets are highly speculative. It's essential to approach trading with caution and diversify your sources of information. Conclusion Conclusion In the exciting world of cryptocurrency trading, reading crypto charts is an indispensable skill. Armed with the knowledge gained from this guide, you'll be better equipped to make informed trading decisions. Remember that practice makes perfect, so start analyzing crypto charts and refining your skills. Happy trading! Follow Us On Social Media Instagram


![READ [PDF] Bar Exam Success: A Comprehensive Guide: A Comprehensive Guide (](https://cdn7.slideserve.com/12503608/bar-exam-success-a-comprehensive-guide-dt.jpg)