Download

1 / 14
150 likes | 347 Views
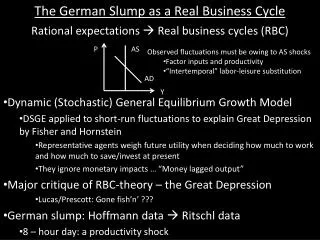
A Fractal Comparison of Real and Austrian Business Cycle Theory. Robert F. Mulligan Western Carolina University. Real Business Cycle Theory. Random, but persistent changes in factor productivity Note – not “antipersistent” cause persistent upswings and downswings in output and employment

E N D
A Fractal Comparison of Real and Austrian Business Cycle Theory Robert F. Mulligan Western Carolina University
Real Business Cycle Theory • Random, but persistent changes in factor productivity • Note – not “antipersistent” • cause persistent upswings and downswings in output and employment • productivity should be stochastically dependent over time
Austrian Business Cycle Theory • Monetary expansion depresses interest rates • Firms respond by increasing investment, even at lower levels of productivity • Households respond by saving less and demanding more consumption goods • Recession is the collapse of this unsustainable expansion
Stochastic Dependence • Monthly data (1959-2006): • M1, M2, M3, MZM, MB, Currency, Nominal Consumption, and the Consumption deflator • IIP but only for 1 & 2 AR terms • Quarterly data (1947-2006): • M1, M2, MB, Nominal Consumption, and all productivity measures
Productivity Indices • RBC Productivity = Consumption/Investment • ABC Productivity = (C - ∆M)/(I + ∆M) • Rationale: • a) part of C under monetary expansion is goods-in-process brought forward prematurely • increase in consumption demand comes from lowered interest rates and saving • b) ∆M in denominator is difference between I & S • actual investment should include goods-in-process brought forward for immediate consumption
Lo Modified R/S M1 3.32571 2.89285 2.60312 2.4221 2.27724 2.15938 2.07015 1.99938 0.00000*** 0.00000*** 0.00007*** 0.00036*** 0.00124*** 0.00315*** 0.00612 ** 0.01011 ** M2 3.46758 2.99392 2.69202 2.48458 2.32315 2.19482 2.09177 2.00902 0.00000*** 0.00000*** 0.00003*** 0.00021*** 0.00084*** 0.00239*** 0.00522 ** 0.00945 ** MB 3.27019 2.8996 2.66144 2.48498 2.34316 2.23141 2.13708 2.05403 0.00000*** 0.00000*** 0.00004*** 0.00021*** 0.00071*** 0.00179*** 0.00373*** 0.00687 ** RP 2.7654 2.333 2.09299 1.94231 1.83737 1.75876 1.6953 1.64139 0.00001*** 0.00078*** 0.00518 ** 0.01490 ** 0.02923 ** 0.04679 ** 0.06694 * 0.08935 * AP1 3.00105 2.52607 2.25997 2.09153 1.97312 1.88391 1.81197 1.75144 0.00000*** 0.00014*** 0.00142*** 0.00523 ** 0.01211 ** 0.02182 ** 0.03414 ** 0.04881 ** AP2 3.44684 2.88252 2.55647 2.34426 2.19134 2.07343 1.97766 1.89731 0.00000*** 0.00000*** 0.00011*** 0.00071*** 0.00246*** 0.00597 ** 0.01174 ** 0.02002 ** APB 2.79195 2.35869 2.1195 1.97094 1.86826 1.79163 1.72937 1.67584 0.00001*** 0.00063*** 0.00425*** 0.01229 ** 0.02410 ** 0.03857 ** 0.05537 * 0.07442 * Note: The null hypothesis is no stochastic dependence. Probability levels given below the Lo test statistics. Statistical significance at the 10% level indicated by *, at the 5% level **, at the 1% level by ***.
Lo Analysis of Productivity Indices • Strong evidence of stochastic dependence • (but not in any real variables except IIP) • RBC productivity should be stochastically dependent over time • but not antipersistent or ergodic • ABC productivity: • persistent monetary injection should induce stochastic persistence • Ergodicity not predicted by ABC, but compatible with it!
Next Steps • Remove outliers • Apparently outliers don’t overcome stochastic dependence for this data • Add lagged changes to M • Should induce more dependence in ABC productivity • Drives more of a wedge between ABC and RBC productivity indices • Examine different subperiods • Different Fed Chairmen tenures • Business cycle trough-to-peak
Estimated Hurst Exponent H, Various Methods • R/S • Power Spectral Density Function • Roughness-Length • Variogram • Wavelets var R/S PowSpec R/L Vgm Wvlt NC 0.087 -0.499 0.127 -0.036 0.311 P 0.418 0.248 0.395 0.245 0.243 M1 0.018 -0.0585 0.188 0.124 0.504 RP 0.301 0.2655 0.372 0.225 0.199 AP1 0.307 0.2575 0.362 0.219 0.234
Other significant finding • Macro series are generally ergodic • aka antipersistent • mean reverting • negative-serially-correlated • “pink noise” • Suggests activist monetary injection results in high volatility
Alternative explanation of ergodicity • Disequilibrium adjustment is everywhere
Conclusion -- Stochastic Dependence implied by both ABC & RBC Ergodicity or antipersistence better supports ABC