
Full 3D Phononic Bandgaps in Optomechanical Crystals: Insights and Simulations
This study delves into the characteristics of full 3D phononic bandgaps in optomechanical crystals, particularly focusing on a silicon thin-film structure. We present SEM images and dimensional analyses alongside 3D-FEM simulations of localized acoustic modes. Key findings include the relationship between bridge width and the acoustic modes' properties, illustrated with quantified coupling rates and acoustic radiation Q-factors. This comprehensive approach enhances our understanding of optomechanical interaction within phononic bandgap frameworks, with implications for advanced optical and acoustic technologies.

Full 3D Phononic Bandgaps in Optomechanical Crystals: Insights and Simulations
E N D
Presentation Transcript
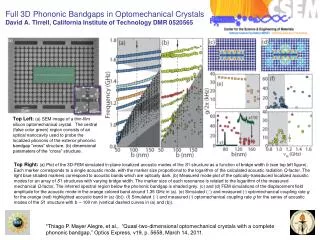
Full 3D PhononicBandgaps in Optomechanical CrystalsDavid A. Tirrell, California Institute of Technology DMR 0520565 Top Left: (a) SEM image of a thin-film silicon optomechanical crystal. The central (false color green) region consists of an optical nanocavity used to probe the localized phonons of the exterior phononicbandgap “cross” structure. (b) dimensional parameters of the “cross” structure. Top Right: (a) Plot of the 3D-FEM simulated in-plane localized acoustic modes of the S1 structure as a function of bridge width b (see top left figure). Each marker corresponds to a single acoustic mode, with the marker size proportional to the logarithm of the calculated acoustic radiation Q-factor. The light blue shaded markers correspond to acoustic bands which are optically dark. (b) Measured mode plot of the optically-transduced localized acoustic modes for an array of S1 structures with varying bridge width. The marker size of each resonance is related to the logarithm of the measured mechanical Q-factor. The inferred spectral region below the phononicbandgap is shaded grey. (c) and (d) FEM simulations of the displacement field amplitude for the acoustic mode in the orange colored band around 1.35 GHz in (a). (e) Simulated () and measured (◦) optomechanical coupling rate g for the orange (red) highlighted acoustic band in (a) ((b)). (f) Simulated () and measured (◦) optomechanical coupling rate g for the series of acoustic modes of the S1 structure with b ∼ 100 nm (vertical dashed curves in (a) and (b)). *Thiago P. Mayer Alegre, et al., “Quasi-two-dimensional optomechanical crystals with a complete phononicbandgap,” Optics Express, v19, p. 5658, March 14, 2011.