Download
1 / 12
120 likes | 215 Views
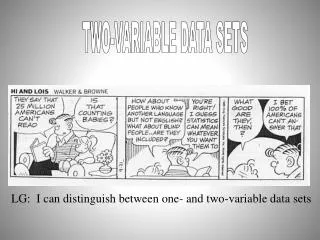
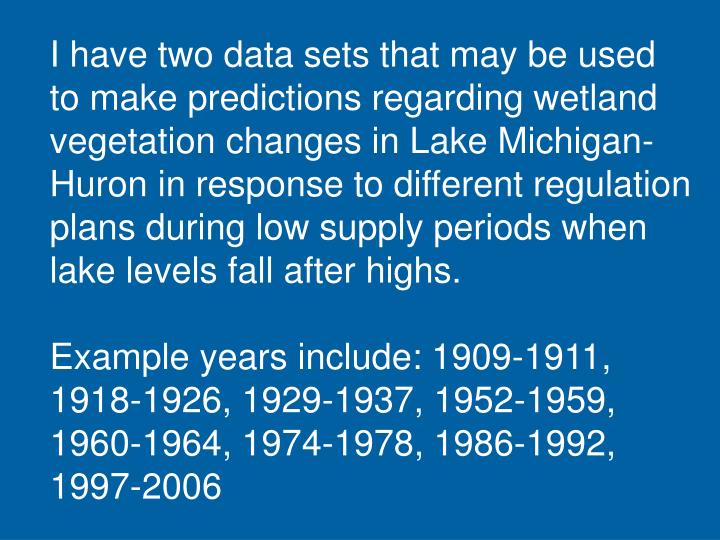
I have two data sets that may be used to make predictions regarding wetland vegetation changes in Lake Michigan- Huron in response to different regulation plans during low supply periods when lake levels fall after highs. Example years include: 1909-1911, 1918-1926, 1929-1937, 1952-1959,

E N D
I have two data sets that may be used to make predictions regarding wetland vegetation changes in Lake Michigan- Huron in response to different regulation plans during low supply periods when lake levels fall after highs. Example years include: 1909-1911, 1918-1926, 1929-1937, 1952-1959, 1960-1964, 1974-1978, 1986-1992, 1997-2006
Lake Michigan-Huron 76.0 75.5 75.0 Lake Level (meters, IGLD 1985) 74.5 74.0 73.5 1 1 1 1 1 1 1 1 1 1 1 1 1 1 2 8 8 8 8 9 9 9 9 9 9 9 9 9 9 0 6 7 8 9 0 1 2 3 4 5 6 7 8 9 0 0 0 0 0 0 0 0 0 0 0 0 0 0 0 0
Six years of elevation-specific data from Fish Point wetland in Saginaw Bay of Lake Huron 500m-long transects 1-6 follow contours at elevations of 176.3, 176.55, 176.65, 176.9, 177.24, and 177.34 m IGLD1985 Distance between transects, creating 220-500m 1-2 = 180m topo/bath platform 2-3 = 10m 3-4 = 25m 4-5 = 10m 5-6 = 5m
Figure 2. Map of Fish Point wetland study area in Saginaw Bay of Lake Huron, Michigan, USA showing approximate placement of seven sampling transects that follow elevation contours.
Plant communities characterized across years by NMDS ordination show distinct groupings of transects/year that reflect response of vegetation to hydrologic history of transects and elevation above water level in the year sampled. Model derived demonstrating these relationships. Wilcox and Nichols. 2008. Wetlands 28:487-501
These relationships might be used to predict the percentage of wetland in each vegetation type based on the 220-500m geometric model and the portions of the wetland that fall into specific time-dewatered and elevation classes. Comparisons would be made in responses to different regulation plans.
for any given year: ∑ X1 …+… X7 = 100 X1 = % wetland under water Veg Type I X2 = % wetland first year dewatered Veg Type II X3 = % wetland dewatered 1 yr [1-15cm] Veg Type III X4 = % wetland dewatered 1 yr [16-40 cm] Veg Type IV or 2 yr [10-40 cm] X5 = % wetland dewatered 2 yr [41-80 cm] Veg Type V or 3 yr [35-70 cm] or 4 yr [30-65 cm] or 5 yr [25-50 cm] X6 = % wetland dewatered 3 yr [71+ cm] Veg Type VI or 4 yr [66+ cm] or 5 yr [51+ cm] or 6 yr [40+ cm] X7 = % wetland not flooded Veg Type VII
transect:year Veg Type I 1:88, 2:88 Veg Type II 2:89, 3:88 Veg Type III 3:89 Veg Type IV 2:90, 2:90, 4:88, 4:89 Veg Type V 4:90, 4:91, 4:92, 5:88, 5:89 Veg Type VI 5:90, 5:91, 5:92, 5:93 Veg Type VII 6:88, 6:89, 6:90
dominants Veg Type I N. flexilis, N. marina, Chara, M. sibiricum Veg Type II Chara, N. flexilis, P. gramineus, H. dubia Veg Type III Chara, P. gramineus, N. flexilis, S. tabernaemontani Veg Type IV Chara, S. pungens, T. angustifolia, S. tabernae. Veg Type V S. pungens, E. perfoliatum, T. ang., C. canadensis Veg Type VI E. graminifolia, C. canadensis, S. exigua, S.pungens Veg Type VII I. capensis, T. angustifolia, C. canadensis, E. perfol.