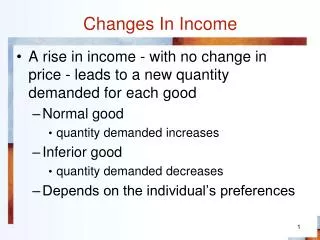
Changes in Income
210 likes | 347 Views
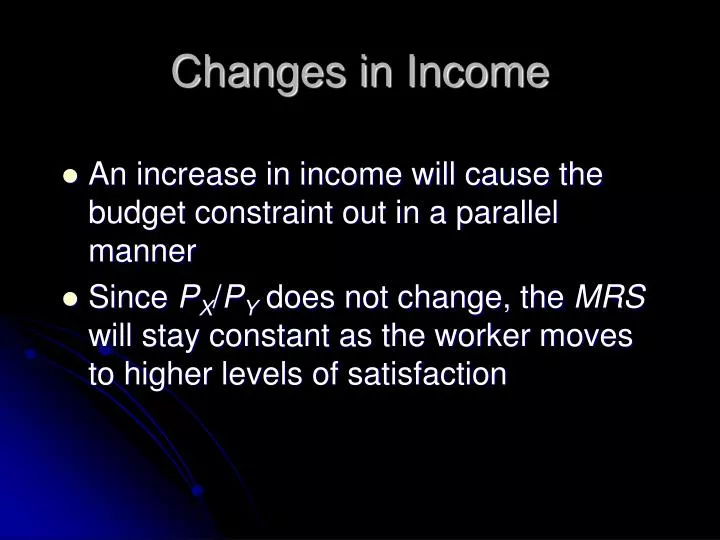
Changes in Income. An increase in income will cause the budget constraint out in a parallel manner Since P X / P Y does not change, the MRS will stay constant as the worker moves to higher levels of satisfaction. C. B. A. U 3. U 2. U 1. Increase in Income.

Changes in Income
E N D
Presentation Transcript
Changes in Income • An increase in income will cause the budget constraint out in a parallel manner • Since PX/PY does not change, the MRS will stay constant as the worker moves to higher levels of satisfaction
C B A U3 U2 U1 Increase in Income • If both X and Y increase as income rises, X and Y are normal goods Quantity of Y As income rises, the individual chooses to consume more X and Y Quantity of X
C B U3 U2 A U1 Increase in Income • If X decreases as income rises, X is an inferior good As income rises, the individual chooses to consume less X and more Y Quantity of Y Note that the indifference curves do not have to be “oddly” shaped. The assumption of a diminishing MRS is obeyed. Quantity of X
Engel’s Law • Using Belgian data from 1857, Engel found an empirical generalization about consumer behavior • The proportion of total expenditure devoted to food declines as income rises • food is a necessity whose consumption rises less rapidly than income
Substitution & Income Effects • Even if the individual remained on the same indifference curve when the price changes, his optimal choice will change because the MRS must equal the new price ratio • the substitution effect • The price change alters the individual’s “real” income and therefore he must move to a new indifference curve • the income effect
Changes in a Good’s Price • A change in the price of a good alters the slope of the budget constraint • it also changes the MRS at the consumer’s utility-maximizing choices • When the price changes, two effects come into play • substitution effect • income effect
Suppose the consumer is maximizing utility at point A. If the price of good X falls, the consumer will maximize utility at point B. B A U2 U1 Total increase in X Changes in a Good’s Price Quantity of Y Quantity of X
To isolate the substitution effect, we hold “real” income constant but allow the relative price of good X to change The substitution effect is the movement from point A to point C C Substitution effect Changes in a Good’s Price Quantity of Y B The individual substitutes good X for good Y because it is now relatively cheaper A U2 U1 Quantity of X
The income effect is the movement from point C to point B Income effect Changes in a Good’s Price Quantity of Y The income effect occurs because the individual’s “real” income changes when the price of good X changes B If X is a normal good, the individual will buy more because “real” income increased A C U2 U1 Quantity of X
The substitution effect is the movement from point A to point C C The income effect is the movement from point C to point B Substitution effect Income effect Changes in a Good’s Price Quantity of Y An increase in the price of good X means that the budget constraint gets steeper A B U1 U2 Quantity of X
Price Changes forNormal Goods • If a good is normal, substitution and income effects reinforce one another • When price falls, both effects lead to a rise in QD • When price rises, both effects lead to a drop in QD
Price Changes forInferior Goods • If a good is inferior, substitution and income effects move in opposite directions • The combined effect is indeterminate • When price rises, the substitution effect leads to a drop in QD, but the income effect leads to a rise in QD • When price falls, the substitution effect leads to a rise in QD, but the income effect leads to a fall in QD
Giffen’s Paradox • If the income effect of a price change is strong enough, there could be a positive relationship between price and QD • An increase in price leads to a drop in real income • Since the good is inferior, a drop in income causes QD to rise • Thus, a rise in price leads to a rise in QD
Summary of Income & Substitution Effects • Utility maximization implies that (for normal goods) a fall in price leads to an increase in QD • The substitution effect causes more to be purchased as the individual moves along an indifference curve • The income effect causes more to be purchased because the resulting rise in purchasing power allows the individual to move to a higher indifference curve
Summary of Income & Substitution Effects • Utility maximization implies that (for normal goods) a rise in price leads to a decline in QD • The substitution effect causes less to be purchased as the individual moves along an indifference curve • The income effect causes less to be purchased because the resulting drop in purchasing power moves the individual to a lower indifference curve
Summary of Income & Substitution Effects • Utility maximization implies that (for inferior goods) no definite prediction can be made for changes in price • The substitution effect and income effect move in opposite directions • If the income effect outweighs the substitution effect, we have a case of Giffen’s paradox
…quantity of X demanded rises. PX1 PX2 PX3 U3 dX U2 U1 X1 X2 X3 X1 X2 X3 I = PX1 + PY I = PX2 + PY I = PX3 + PY The Individual’s Demand Curve Quantity of Y As the price of X falls... PX Quantity of X Quantity of X
The Individual’s Demand Curve • An individual demand curve shows the relationship between the price of a good and the quantity of that good purchased by an individual assuming that all other determinants of demand are held constant
Shifts in the Demand Curve • Three factors are held constant when a demand curve is derived • income • prices of other goods • the individual’s preferences • If any of these factors change, the demand curve will shift to a new position
Shifts in the Demand Curve • A movement along a given demand curve is caused by a change in the price of the good • called a change in quantity demanded • A shift in the demand curve is caused by a change in income, prices of other goods, or preferences • called a change in demand