Download
1 / 7
70 likes | 199 Views
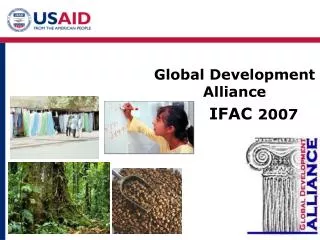
Global Development Alliance IFAC 2007. US Total Resource Flows to the Developing World in 2005: $158 BN. PUBLIC FLOWS 18%. U.S. Government Official Development Assistance 18%. Foundations 2%. Corporate Foundations 1%. Private Capital Flows (FDI and Net Cap Markets) 44%.

E N D
Global Development Alliance IFAC 2007
US Total Resource Flows to the Developing World in 2005: $158 BN PUBLIC FLOWS 18% U.S. Government Official Development Assistance 18% Foundations 2% Corporate Foundations 1% Private Capital Flows (FDI and Net Cap Markets) 44% NGO Grants 3% PRIVATE FLOWS 82% Religious Organizations 5% Universities and Colleges 1% Remittances 26% USAID, January 2007
Incentives for Business • Increased market shares • Reputation boost due to public perception of corporate social responsibility • Access to USAID’s strengths: • Collaboration with policymakers and key institutions • Development expertise • Long-term in-country presence • Funding • Network of local and global partners
What Partners Contribute • Funding • Markets & Purchasing Power • Activity Design Better Connected to Market Realities • Technology & Intellectual Property • Skills, Services & Expertise • Synergies Resulting from Joint Efforts
Alliance Summary for FY 02 – 05* Approximately 400 alliances Agency-wide With over $1.4 billion in USAID funds leveraging over $4.6 billion in partner resources • Africa: 97 country-specific & 29 regional totaling $1.41b • Asia/Near East: 55 country & 7 regional totaling $303m • Europe & Eurasia: 52 country & 9 regional totaling $307m • Latin America: 72 country & 22 regional totaling $443m • Worldwide: 54 global alliances totaling $3.573b This information is updated regularly and subject to change Base: 2006 Matrix
Worldwide Alliances Snapshot • Global Health • Avian Influenza • Global Alliance for Improved Nutrition (GAIN) • Seaboard Health Clinic • Education • Computerization of Primary and Secondary Schools • (Macedonia) • Books for Africa • Sesame Street • Economic Growth • Finance Alliance for Sustainable Trade (Africa/LAC) • International Accounting Alliance • IT • Cisco Learning Academies (Africa, Afghanistan, Iraq) • AMIR/CASE Foundation ICT Project (Jordan) • Agriculture • International Small Group and Tree Planting Program • (Tanzania) • Milk Collection Centers Alliance (Zambia) • Ecologic/Starbucks • Anti-Corruption/Governance/Democracy • Balkan Trust for Democracy • Truth and Reconciliation in Colombia