Download
1 / 23
230 likes | 258 Views
Learn the significance of pressure-volume diagrams in thermodynamics, rank states by temperature, explore isotherms, and understand the first law of thermodynamics. Solve P-V diagram questions and analyze energy transfer processes.

E N D
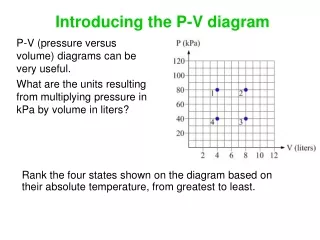
Introducing the P-V diagram P-V (pressure versus volume) diagrams can be very useful. What are the units resulting from multiplying pressure in kPa by volume in liters? Rank the four states shown on the diagram based on their absolute temperature, from greatest to least.
Introducing the P-V diagram P-V (pressure versus volume) diagrams can be very useful. What are the units resulting from multiplying pressure in kPa by volume in liters? Rank the four states shown on the diagram based on their absolute temperature, from greatest to least. Temperature is proportional to PV, so rank by PV: 2 > 1=3 > 4.
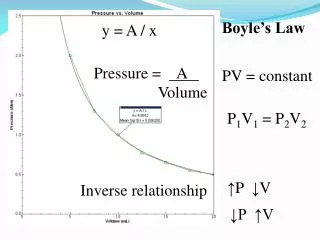
Isotherms Isotherms are lines of constant temperature. On a P-V diagram, isotherms satisfy the equation: PV = constant
Thermodynamics Thermodynamics is the study of systems involving energy in the form of heat and work. Consider a cylinder of ideal gas, at room temperature. When the cylinder is placed in a container of hot water, heat is transferred into the cylinder. Where does that energy go? The piston is free to move up or down without friction.
The First Law of Thermodynamics Some of the added energy goes into raising the temperature of the gas (we call this raising the internal energy). The rest of it does work, raising the piston. Conserving energy: (the first law of thermodynamics) Q is heat added to a system (or removed if it is negative) is the internal energy of the system (the energy associated with the motion of the atoms and/or molecules), so is the change in the internal energy, which is proportional to the change in temperature. W is the work done by the system. The First Law is often written as
Work We defined work previously as: (true if the force is constant) F = PA, so: At constant pressure the work done by the system is the pressure multiplied by the change in volume. If there is no change in volume, no work is done. In general, the work done by the system is the area under the P-V graph. This is why P-V diagrams are so useful.
Work: the area under the curve The net work done by the gas is positive in this case, because the change in volume is positive, and equal to the area under the curve.
An ideal gas initially in state 1 progresses to a final state by one of three different processes (a, b, or c). Each of the possible final states has the same temperature. For which process is the change in internal energy larger? 1. a 2. b 3. c 4. Equal for all three 5. We can’t determine it A P-V diagram question
A P-V diagram question Because the change in temperature is the same, the change in internal energy is the same for all three processes.
An ideal gas initially in state 1 progresses to a final state by one of three different processes (a, b, or c). Each of the possible final states has the same temperature. For which process is more heat transferred into the ideal gas? 1. a 2. b 3. c 4. Equal for all three 5. We can’t determine it Another P-V diagram question
Another P-V diagram question The heat is the sum of the change in internal energy (which is the same for all three) and the work (the area under the curve), so whichever process involves more work requires more heat.
Another P-V diagram question The heat is the sum of the change in internal energy (which is the same for all three) and the work (the area under the curve), so whichever process involves more work requires more heat. Process c involves more work, and thus requires more heat.
We have two identical cylinders of ideal gas. Piston 1 is free to move. Piston 2 is fixed so cylinder 2 has a constant volume. We put both systems into a reservoir of hot water and let them come to equilibrium. Which statement is true? 1. Both the heat Q and the change in internal energy will be the same for the two cylinders 2. The heat is the same for the two cylinders but cylinder 1 has a larger change in internal energy. 3. The heat is the same for the two cylinders but cylinder 2 has a larger change in internal energy. 4. The changes in internal energy are the same for the two cylinders but cylinder 1 has more heat. 5. The changes in internal energy are the same for the two cylinders but cylinder 2 has more heat. Constant volume vs. constant pressure
Constant volume vs. constant pressure Each cylinder comes to the same temperature as the reservoir. How do the changes in internal energy compare? Which cylinder does more work?
Constant volume vs. constant pressure Each cylinder comes to the same temperature as the reservoir. How do the changes in internal energy compare? The same number of moles of the same gas experience the same temperature change, so the change in internal energy is the same. Which cylinder does more work? Cylinder 2 does no work, so cylinder 1 does more work. By the first law, cylinder 1 requires more heat to produce the same change in temperature as cylinder 2. The heat required depends on the process.
Solving thermodynamics problems A typical thermodynamics problem involves some process that moves an ideal gas system from one state to another. Draw a P-V diagram to get some idea what the work is. Apply the First Law of Thermodynamics (this is a statement of conservation of energy). Apply the Ideal Gas Law. the internal energy is determined by the temperature the change in internal energy is determined by the change in temperature the work done depends on how the system moves from one state to another (the change in internal energy does not)
Constant volume (isochoric) process No work is done by the gas: W = 0. The P-V diagram is a vertical line, going up if heat is added, and going down if heat is removed. Applying the first law: For a monatomic ideal gas:
Constant pressure (isobaric) process In this case the region on the P-V diagram is rectangular, so its area is easy to find. For a monatomic ideal gas:
Heat capacity For solids and liquids: For gases: , where C, the heat capacity, depends on the process. For a monatomic ideal gas Constant volume: Constant pressure: In general:
Constant temperature (isothermal) process No change in internal energy: The P-V diagram follows the isotherm. Applying the first law, and using a little calculus:
Zero heat (adiabatic) process Q = 0. The P-V diagram is an interesting line, given by: For a monatomic ideal gas: Applying the first law: