Download
1 / 22
220 likes | 334 Views
Model Testing of Creative Strategies and Performance Targets in Napa County, California. PRESENTED BY Joseph Story, AICP DKS Associates. May 20, 2009. Sensitivity Testing on a Regional Multimodal Model Provided Insight on Its Usefulness for New Policy Questions.

E N D
Model Testing of Creative Strategies and Performance Targets in Napa County, California PRESENTED BY Joseph Story, AICP DKS Associates May 20, 2009
Sensitivity Testing on a Regional Multimodal Model Provided Insight on Its Usefulness for New Policy Questions • Setting of Napa’s Unique Travel Characteristics • Overview of Napa’s Transportation Future Process and Recommendations • Tool: Solano / Napa Super-Regional Travel Demand Model • Results of Testing of Recommended Strategies • Strengths and Shortcomings of Model Application
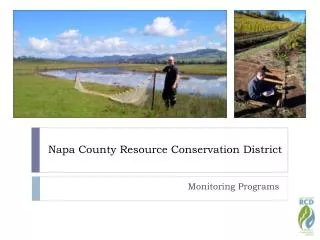
Napa’s Setting: Well-Known Wine Country Popularity Promotes a Growth Environment
Napa’s Setting: Tourism and Agricultural Economies Produce Swings in Employment and Traffic • Major Areas of Concern NOTCommuter Focused • Difficult to Resolve Employment Estimates
Napa’s Setting: Land Preservation Strategies Encourage Growth South of Downtown Napa
Napa’s Transportation FutureProcess and Recommendations • Prior strategic plans had capital projects focus • Project designed with extensive public discussion – workshops, lectures, meetings • Broad community recognition that goals to reduce single-occupant driving are important • Model sensitivity testing done after preferred strategies emerged
Napa’s Transportation Future Sets Specific 2035 Goals and Objectives GOAL: REDUCE / RESTRAIN GROWTH OF AUTOMOBILE VEHICLE MILES TRAVELED (VMT) Objective: 0% net growth in aggregate VMT GOAL:SPREAD THE LOAD FROM PEAK TIMES TO NON-PEAK TIMES Objective: Shift 10% of journey-to-work travel from peak to non-peak times GOAL:SHIFT TRAVEL FROM SINGLE-OCCUPANCY VEHICLES TO OTHER MODES Objective: Increase % of trips made by transit to 5% Objective:Increase % of trips made by bicycle and walking to 20% GOAL:REDUCE OVERALL ENERGY USE AND GREENHOUSE GAS (GHG) EMISSIONS Objective: Reduce greenhouse gas emissions from all transportation modes to 40% below 1990 levels
Investigate bus rapid transit systems for Napa County Promote energy efficient and environmentally benign transit systems Real-time bus tracking, traffic light synchronization, “Dial 511” transportation information Maintain options for water transportation, promote freight rail in South County, support a full integration of air transportation connections Maintain critical street and road infrastructure Invest in strategic road system expansion in South County Convert high frequency intersections to roundabout configuration Build bike paths and sidewalks Create satellite park and ride sites Promote bypass road and transit strategies to address pass-through traffic Increase transit (bus) service Actively explore creating a passenger rail system Study Group Recommendations Developed to Address Policy Concerns – Supply Strategies
Work with the wine and hospitality industries to create and promote car-free tourism services Address the special transportation needs of a growing senior population Work with employers to encourage alternatives for commuting and mid-day work trips Parking pricing strategies Promote workforce housing production near jobs Promote urban design and infrastructure development policies to encourage bike and pedestrian activity Promote safe non-auto routes to school, and after school programs Promote well-located health and social service delivery to minimize travel Institute comprehensive growth management guidelines that covers all jurisdictions Study Group Recommendations Developed to Address Policy Concerns – Demand Strategies
The Tool: Napa-Solano Multi-Modal Travel Demand Model • Model design finalized with 2003 work session • Appropriately replicate current and future inter-regional travel demand • Provide local network and TAZ detail in Solano and Napa counties • Most focus on traffic count validation at peak hours • Survey data provided from secondary sources; not part of model scope
The Tool: Napa-Solano Multimodal Travel Demand Model • 1385 Traffic Analysis Zones • Local Solano and Napa County models (989) • Covers remaining San Francisco Bay Area (282) • Sacramento region (102) • San Joaquin and Lake Counties (12) • Model validated to 2000 • Phase 1 Model (fixed mode shares) accepted in 2006 • Phase 2 Model (HOV, walk / bike and transit mode shares) accepted in 2008
The Tool: Napa-Solano Multimodal Travel Demand Model Network Lake Co SACOG Region Napa Co Solano Co San Joaquin Co Bay Area Counties
A Series of Scenarios Were Tested to Show Results of New Strategies SCENARIOS 1 – Baseline Trends 2 – Adopt Strategies Without Land Use Changes 3 – Adopt Strategies With Land Use Changes 4 – Slower Growth (Shift Jobs to Solano County) 5 – The “What Would It Take” Scenario Napa’s Transportation Future
VMT and VHT Measured by Trip Tables to Best Demonstrate Local Policy Choices • Link-Based VMT/VHT • Portions of trips within Napa County • Includes through trips • Does not look at trip portions outside of County made by local residents / workers Trip-Table Based VMT/VHT • Origins or destinations within Napa • Calculated based on vehicle trip ends • Trips leaving / entering County counted as half of intra-county trips
Testing of Baseline Trends (Scenario 1) • Findings of all trips (to / from / within County) • Trip-Based VMT increases 36% AM and 38% PM • Trip-Based VHT increases 80% AM and 76% PM • Observations • Growth in most congested portion (South of Napa) of Napa County • Growth areas are in Bay Area commuter markets – with longer commutes • Through trip increases from Napa County
Testing of Strategies on Fixed Land Use (Scenario 2) • Assumptions • Roadways • Widening / extensions of South County arterials • Local road projects • Transit frequencies doubled • Bicycle-pedestrian connections improved to be twice as fast (“attractive”)
Testing of Strategies on Fixed Land Use (Scenario 2) • Results • Combined improvements have small aggregate effect • Over 300 fewer work trips in vehicles • 80 to 90 fewer vehicle trips on the road • HBW transit / walk / bicycle mode share forecast increased from 7.6% to 7.9% for intra-county trips • Decrease in VMT and VHT of 1 to 4 % • Greater at PM peak hour (shorter non-work trips)
Testing of Strategies with Land Use Changes (Scenario 3) • Assumptions • Relocation of 1500 households and 500 jobs to potential mixed-use growth areas • Results • Less profound changes in VMT / VHT than mere transportation improvements • HBW transit / walk / bicycle mode share forecast remained 7.9% for intra-county trips • Increased VMT / VHT from land use changes of 1 to 2%
Testing of Slower Growth (Scenario 4) • Assumptions • Future jobs reduced from 97K to 85K • Jobs relocated to Solano County • No network changes from Scenario 1 – Baseline (not strategy network) • Network reflects less need to make and fund expansion • Results • 1% AM VMT reduction & 2% increase in AM VHT • 2% increase in PM VMT and VHT • HBW transit / walk / bicycle mode share of 7.7% for intra-county trips
Testing of “What Would It Take” (Scenario 5) • Assumptions • Parking charges of 50 cents per hour everywhere in Napa County • Bus frequencies at 10 minutes • Pedestrian accessibility improved 500% • Bicycling becomes as attractive as nearby college town • Results • HBW transit / walk / bicycle mode share grows to 27.6% for intra-county trips • 4% decrease in AM and PM VMT; 6% decrease in AM and PM VHT • Benefits occurred on short-distance trips
Strengths of Using this Model for Sensitivity Testing • Model showed some benefit in congestion reduction and slight mode shifts to transit / walk / bicycle, especially with short-distance trips • Strategies illustrate the challenges of achieving carbon footprint reductions where land uses and lifestyles are fixed • Scenarios demonstrated that shifting growth to the wrong areas – even as mixed-use or high-density development – can increase VMT / VHT if the area is congested • Complex relationships between land use and transportation • Density and diversity may not result in reductions
Shortcomings of Using this Model for Sensitivity Testing • Model was not necessarily built or calibrated to answer emerging policy questions • Model responsiveness appeared to somewhat “fail” because it did not respond significantly to varied scenario assumptions, although the inherent model design and fixed assumptions on behavior, land use and transportation were likely causes • Metrics from partial geographic data prone to volatility that masks potential policy-based model inputs • Trip-table-based VMT / VHT • Use of VMT / VHT per household