Download
1 / 44
460 likes | 682 Views
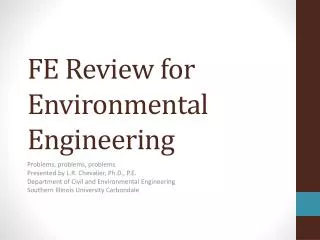
FE Review for Environmental Engineering. Problems, problems, problems Presented by L.R. Chevalier, Ph.D., P.E. Department of Civil and Environmental Engineering Southern Illinois University Carbondale. FE Review for Environmental Engineering. Mathematical/Physical Foundations.

E N D
FE Review for Environmental Engineering Problems, problems, problems Presented by L.R. Chevalier, Ph.D., P.E. Department of Civil and Environmental Engineering Southern Illinois University Carbondale
FE Review for Environmental Engineering Mathematical/Physical Foundations
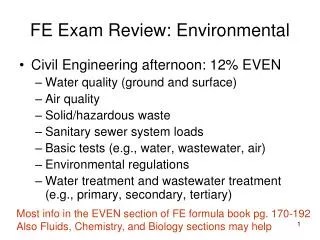
Review the definitions of • TS • TDS • TSS • VDS • FDS • VSS • FSS • Assume a 1 liter sample • Divide 700 mg by the percentage shown or calculated
Review definitions • Fixed mean inorganic – it does not burn • Volatile means organic – it does burn
Sodium chloride 45 mg/L Dissolves Doesn’t volatilize 45 45 45
Calcium sulfate 30 mg/L Dissolves Doesn’t volatizes 45 30 45 30 45 30
Clay 100 mg/L Doesn’t dissolve Doesn’t volatizes 45 30 100 100 45 30 100 45 30
Copper chloride 10 mg/L Dissolves Doesn’t volatizes 45 30 10 100 45 30 10 100 45 30 10 100
Acetic acid 20 mg/L Dissolves Volatizes 45 20 30 10 100 45 20 30 10 100 45 30 10 20 100
Coffee grounds 25 mg/L Doesn’t dissolves Volatizes 45 20 30 10 100 25 45 20 30 10 100 25 20 45 30 10 25 100
Water flows into a heated tank at a rate of 150 gal/min. • Evaporation losses are estimated to be 2000 lb/hr. • Assuming the tank volume to be constant, what is the flow rate out of the tank?
Draw a schematic (control volume) • Convert to like units (Weight of water 8.34 lb/gal) • Mass in = Mass out • concept of density (Volume in = Volume out) 2000 lb/hr 150 gpm ?
Consider the following report from three supplies into a reservoir. Is it correct?
Important Rule: We can add mass (mass balance) but not concentrations X
1. What is the total volume of water per day? 140 gpm + 5 gpm + 5 gpm = 150 gpm Converting to liters/day (L/d) (150 gpm)(3.785 L/gal)(60 min/hr)(24 hr/day) = 817560 L/d
2. What is the mass from source B? (5 gpm)(3.785 L/gal)(500 mg/L)(60 min/hr)(24 hr/d) = 1.36 x 10⁷ mg/d Converting to ppm per day in total water 1.36 x 10⁷ mg/ 817560 L = 16.67 mg/L = 16.67 ppm
3. What is the mass from source C? (5 gpm)(3.785 L/gal)(500 mg/L)(60 min/hr)(24 hr/d) = 1.36 x 10⁷ mg/d Converting to ppm per day in total water 1.36 x 10⁷ mg/ 817560 L = 16.67 mg/L = 16.67 ppm
4. Therefore, we have 16.67 ppm benzene, and 16.67 ppm toluene! Not 1000 ppm! 5. Can we add these concentrations?
Simple Model Of Stream Pollution Based On Mass Balance Qe Ce Industrial Complex Qu Cu Qd Cd
A factory for copper and brass plating is dumping its wastewater effluent into a near-by stream. • Local regulations limit the copper concentration in the stream to 0.005 mg/L. • Upstream flow in stream, 0.5 m3/s. Concentration of copper in upstream flow is below detection limits • Effluent flow from plating factory 0.1 m3/s • Determine the maximum concentration allowable in the effluent from the factory’s wastewater.
Draw a control volume diagram • Determine Qtotal = Qstream + Qeffleuent • Convert concentrations to mass (mass flux) • Use mass balance to determine the allowable concentration (based on mass) of effluent
Qe =0.1 m3/s Ce = ? Industrial Complex Qd = ? Cd = 0.005 mg/L Qu= 0.5 m3/s Cu = 0 mg/L
SIMPLE PHOSPHOROUS MODEL Want to estimate the amount of phosphorous control needed to prevent eutrophication due to the over-production of algae
Simple Phosphorous Model • Completely mixed lake • Steady state • Constant settling rate • Phosphorous is the controlling nutrient Assumptions:
Schematic Of System Waste water treatment plant Q = 0.2 m3/s P=5.0 mg/L Stream Q = 15.0 m3/s P=0.01 mg/L Settling rate vs = 10 m/yr Surface area of lake 80 x 106 m2
Estimate P • What rate of phosphorous removal at the wastewater treatment plant would be required to keep the concentration of phosphorous in the lake at an acceptable level of 0.01 mg/L?
Evaluate all inputs and outputs to the control volume • Qin = Qout • QCin = QCout
Using mass balance approach:Rate of addition of P = Rate of removal of P Sources QwwtPwwt QstreamPstream
Using mass balance approach:Rate of addition of P = Rate of removal of P Outflow rate, QtPlake Area, A Concentration, Plake Settling rate, AvsPlake
Rate of addition of P = Rate of removal of P S = QTPlake+ vsAPlake where: S = rate of addition of phosphorus from all sources (g/s) P = concentration of phosphorus (g/m3) QT= stream outflow rate (m3/s) vs= the phosphorus settling rate (m/s) A = surface area of the lake (m2)
which results in a steady-state concentration of Of note, vs is empirically derived and difficult to predict with any confidence. Suggest a settling rate of 3-30 m/year.
1. Determine the mass loading from both sources Phosphorous loading from incoming stream: Ss = (15.0 m3/s)(0.01 mg/L)(g/1000mg)/(1000 L/m3) = 0.15 g/s From the wastewater treatment plant: Sw = (0.2 m3/s)(5.0 mg/L)(1 g/m3)/(mg/L) = 1 g/s For a total loading of S = 0.15 g/s + 1.0 g/s = 1.15 g/s
2. Determine the volume (mass) of water entering over time: Neglecting evaporation QT= 15 m3/s + 0.2 m3/s = 15.2 m3/s 3. Estimate the settling rate:
4. Apply model This is above the 0.01 mg/L suggested for acceptable concentration. We cannot reduce background levels in the stream. Therefore, we need to determine the reduction at the plant. To start with, solve for S with a known value of P = 0.01 mg/L
The amount that the wastewater treatment plant could contribute would be: Sw = 0.41g/s – 0.15 g/s = 0.26 g/s Since Sw is now at 1.0 g/s, there is a need for 74% phosphorous removal
Summary of Problem • We basically did a mass balance for • the water supply • the contaminant where M4 is the mass in both the lake and the outgoing stream Q1 M4/T=M1/T+M2/T-M3/T M1/T Q3=Q1+Q2 M2/T M3/T (settling) Q2