Download
1 / 36
360 likes | 483 Views
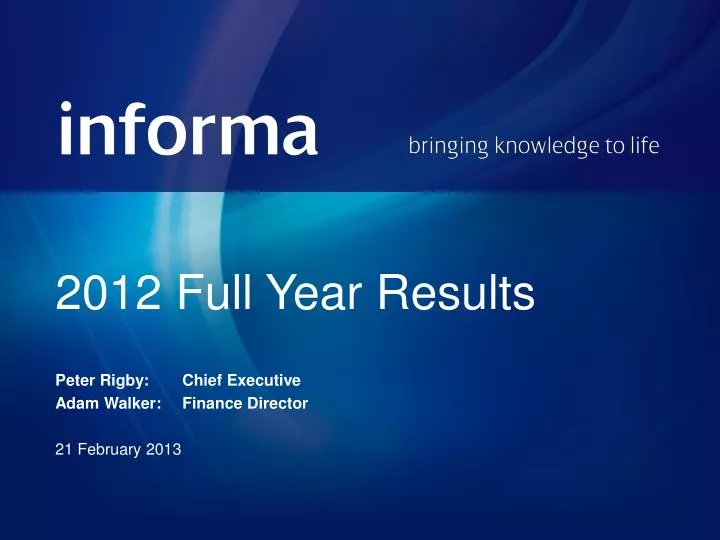
2012 Full Year Results Peter Rigby: Chief Executive Adam Walker: Finance Director 21 February 2013. Introduction Peter Rigby. 2012 Overview. Earnings ahead of market expectations Ongoing strong cash generation Proactive portfolio management Delivering on all strategic objectives

E N D
2012 Full Year Results Peter Rigby: Chief Executive Adam Walker: Finance Director 21 February 2013
Introduction Peter Rigby
2012 Overview • Earnings ahead of market expectations • Ongoing strong cash generation • Proactive portfolio management • Delivering on all strategic objectives • Value accretive acquisitions • Improving mix = higher quality of earnings • Strong balance sheet • Attractive shareholder returns
Financial Summary Adam Walker
Financial Highlights • Revenue broadly flat at £1.23bn • Adjusted operating profit growth of 4.0% to £349.7m • Record adjusted operating margin up 200bps to 28.4% • Record adjusted diluted EPS up 7.7% to 40.7p • Adjusted PBT up 7.3% to £317.4m • Cash conversion of 94%; free cash flow of £237.8m • Balance sheet strength: net debt / EBITDA 2.1x • Total dividend increased 10.1% to 18.5p
M&A activity • Investment focused around strategic objectives • Strict financial criteria • Strong track record of returns • 2012 highlights: • MMPI Canada in July for £30.0m* • Zephyr Associates in October for £38.2m* * Headline consideration 2011 acquisitions – 1st year ROI: 12.0% 2010 acquisitions – 1st year ROI: 12.5% 2009 acquisitions – 1st year ROI: 18.9%
Agrishow in Brazil • Award of a 30-year license to manage Agrishow • Largest agricultural exhibition in Latin America • Brazil is one of the largest exporters of food in the world • 20th edition in São Paulo in April 2013: • Close to 800 exhibitors expected • Over 150,000 visitors • 440,000sqm • Adds to growing portfolio of exhibitions in Brazil
Long-term performance Adjusted EPS (p): CAGR 11% Adjusted operating margin (%) Dividend per share (p): CAGR 15% Net debt / EBITDA (x)
Financial summary • Another year of strong earnings and cash flow growth in 2012 • Dividend increase of 10.1% • Strong balance sheet • Bolt-on acquisitions and disposals • Budgeting for underlying growth in all three divisions in 2013 • A year of margin consolidation in 2013 • Healthy renewal rates and forward bookings
Strategy Update Peter Rigby
Strategic drivers Digital Excellence High Quality Subscriptions Resilient Events Geographic Expansion
Proactive portfolio management • Deliberate product pruning • PCI • E&T • Selective disposals • E&T • Reallocation of assets • PCI Advertising, consulting, one-off reports Small conferences, local language, non-repeatable Robbins Gioia, Austria/Hungary/Czech conferences Medical Books moving to Academic Information Improving the quality of group earnings
Proactive portfolio management • Strategic acquisitions • AI • Focal Press • Hodder Health • PCI • Zephyr • E&T • MMPI • Agrishow Strong brands, niche content, digital potential, cost/revenue synergies Digital subscriptions, high renewal rates, cost/revenue synergies Annual large exhibitions, emerging markets
New product development • Academic Information • SACHA • PCI • Healthcare Knowledge Centre • Verdict • China medical data • Events & Training • Vitafoods South America • Cityscape Qatar
Improving business mix Revenue by type 2007 Revenue by type 2012 Revenue by type 2007 Revenue by type 2012
Improving geographic mix Revenue split 2009 Revenue split 2012 Emerging market revenue 2012 Emerging market revenue 2009
Academic Information Revenue by geography 2012 • ‘Must have’ information • Digital subscriptions • Journal renewal rates >95% • 1,676 journal titles • 87,000 book titles • 16% of book revenue from ebooks • Two thirds HSS, one third STM • Open Access investment Revenue by subject area 2012
Professional & Commercial Information Revenue by geography 2012 • Proprietary content • Strong brands • Niche focus: narrow and deep • Digital subscriptions • Average renewal rate c80% • Analytics and workflow • Medical Books moving to Academic Information Revenue by vertical 2012
Events & Training Revenue by geography 2012 • 6,500 events in 2012 • 17 new launches & geo-clones • Over 250 large events • 44% of revenue from large events • Local language conferences • Emerging markets 27% of E&T revenue • Corporate training still tough Revenue by product 2012
Vertical strength • Building multi-platform strength across industry verticals • Global reach through geo-cloning and digital publishing • Leverage knowledge, contacts, brands across the group • Vertical strengths: • Healthcare & Life Sciences • Agri-Food & Commodities • Anti-Aging & Beauty • Telecoms & Media • Finance
Summary and outlook • Another year of healthy earnings growth • Delivered ahead of expectations • Improving quality of earnings • Increasing shareholder returns • Publishing – focus on subscriptions and digital excellence • Events – focus on large-scale brands • Focus on expanding emerging market presence • Well positioned for 2013
Return on Investment 2011 acquisitions – 1st year ROI - 12.0% 2010 acquisitions – 1st year ROI - 12.5% 2009 acquisitions – 1st year ROI - 18.9% ROI is defined as tax-affected Adjusted EBITDA in the First Year post-acquisition, as a proportion of Total Consideration. Adjusted EBITDA is translated at the exchange rates in effect at the date of acquisition. The Group effective tax rate of 22.6% has been used for the 2012 review of 2011 acquisitions (2011 review: 23.4%). ROCE: ((OP + interest income + adjusting items)*(1-tax rate) + other intangible amortisation)/(total assets – current liabilities + ST debt + accumulated other intangible amortisation + accumulated goodwill impairment)