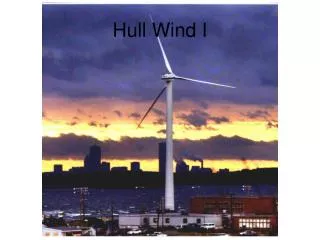
Wind Power: Optimization at All Levels
Wind Power: Optimization at All Levels. Jaime Carbonell www.cs.cmu.edu/~jgc 11-September-2009. Wind Turbines (that work). HAWT: Horizontal Axis. VAWT: Vertical Axis. Wind Turbines (flights of fancy). Wind Power Factoids. Potential: 10X to 40X total US electrical power .01X in 2009

Wind Power: Optimization at All Levels
E N D
Presentation Transcript
Wind Power: Optimization at All Levels Jaime Carbonell www.cs.cmu.edu/~jgc 11-September-2009
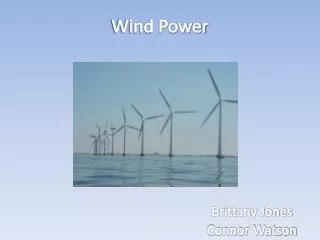
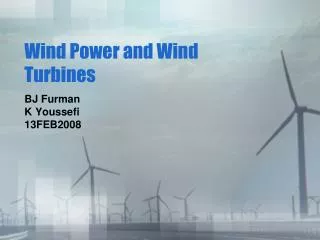
Wind Turbines (that work) HAWT: Horizontal Axis VAWT: Vertical Axis
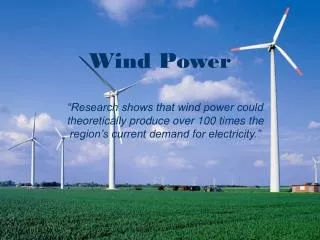
Wind Power Factoids • Potential: 10X to 40X total US electrical power • .01X in 2009 • Cost of wind: $.02 – $.06/kWh • Cost of coal $.02 – $.03 (other fossils are more) • Cost of solar $.25/kWh – Photon Consulting • “may reach $.10 by 2010” Photon Consulting • State with largest existing wind generation • Texas (7.9 MW) – Greatest capacity: Dakotas • Wind farm construction is semi recession proof • Duke Energy to build wind farm in Wyoming – Reuters Sept 1, 2009 • Government accelerating R&D, keeping tax credits • Grid requires upgrade to support scalable wind
Sustained Wind-Energy Density From: National Renewable Energy Laboratory, public domain, 2009
Inside a Wind Turbine GE Wind Energy's 3.6 megawatt wind turbine From Wikipedia
Power Calculation • Wind kinetic energy: • Wind power: • Electrical power: • Cb .35 (<.593 “Betz limit”) • Max value of • Ng .75 generator efficiency • Nt .95 transmission efficiency
Wind v & E match Weibull Dist. Weibull Distribution: Red = Weibulldistribution of wind speed over time Blue = Wind energy (P = dE/dt) Data from Lee Ranch, Colorado wind farm
Optimization Opportunities • Site selection • Altitude, wind strength, constancy, grid access, … • Turbine selection • Design (HAWTs vs VAWTs), vendor, size, quantity, • Turbine Height: “7th root law” • Greater precision for local conditions • Local topography (hills, ridges, …) • Turbulence caused by other turbines • Prevailing wind strengths, direction, variance • Ground stability (support massive turbines) • Grid upgrades: extensions, surge capacity, … • Non-power constraints/preferences • Environmental (birds, aesthetics, power lines, …) • Cause radar clutter (e.g. near airports, air bases) World’s Largest Wind Turbine (7+Megawatts, 400+ feet tall)
Oops... • What’s wrong with this picture? • Proximity of turbines • Orientation w.r.t. prevaling winds • Ignoring local topography • … Near Palm Springs, CA
$1M-3M/MW capacity $3M-20M/turbine Questions Economy of scale? NPV & longevity? Interest rate? Operational costs? Price of Electricity 8% improvement in 25B invested = $2B Price of storage vs upgrade of grid transmission vs both Economic Optimization
Penultimate Optimization Challenge • Objective Function • Construction: cost, time, risk, capacity, … • Grid: access & upgrade cost, • Operation: cost/year, longevity, • Risks: price/year of electricity, demand, reliability, … • Constraints • Grid: Ave & surge capacity, max power storage, … • Physical: area, height, topography, atmospherics, … • Financial: capital raising, timing, NPV discounts, … • Regulatory: environmental, permits, safety, … • Supply chain: availability & timing of turbines, …
Energy Storage • Compressed-air storage • Surprisingly viable • Efficiency ~50% • Pumped hydroelectric • Cheap & scalable • Efficiency < 50% • Advanced battery • Cost prohibitive • Flywheel arrays (unviable) • Superconducting capacitors (missing technology)
Compressed-Air Storage System Wind resource: k = 3, vavg = 9.6 m/s, Pwind = 550 W/m2 (Class 5) hA = 5 hrs. 1.5 Slope ~ 1.7 1 CF = 81% 0.5 CF = 76% PC = 0.85 PT (1700 MW) PG = 0.50 PT (1000 MW) CF = 72% CF = 68% 0 0.5 1 1.5 Comp Gen hS = 10 hrs. (at PC) Wind farm: PWF = 2 PT (4000 MW) Spacing = 50 D2 vrated = 1.4 vavg Eo/Ei = 1.30 Underground storage Transmission: PT = 2000 MW
Optimization To Date • Turbine blade design • Huge literature • Generators • Already near optimal • Wind farm layout • Mostly offshore • Integer programming • Topography • Multi-site • + Transmission • + Storage new challenge
Need Wind Data • Prevalent Direction, Speed, seasonality • Measurement tower position & duration optimization too…
US Investment in Wind Power • 2008 Investment: $16.4B (private + public) • Total since 1980: $45+B • Estimate for 2009-2018: $300B-$700B Optimization can have a huge impact San Goronio Pass, CA
Trusted Third Party • Wind power industry now generates studies for public utilities • Every industry provider (Vestas, GE, Siemens, …) shows their wind-generators are the best no true comparison, no site/context sensitivity. • No global optimization across designs, etc. • Modeling, optimization, assessment is complex, requires expertise • Room for a non-profit expertise pool and models • Track evolving technologies
References • Schmidt, Michael, “The Economic Optimization of Wind Turbine Design” MS Thesis, Georgia Tech, Mech E. Nov, 2007. • Donovan, S. “Wind Farm Optimization” University of Auckland Report, 2005. • Elikinton, C. N. “Offshore Wind Farm Layout Optimization”, PhD Dissertation, UMass, 2007. • Lackner MA, Elkinton CN. An Analytical Framework for Offshore Wind Farm Layout Optimization. Wind Engineering 2007; 31: 17-31. • Elkinton CN, Manwell JF, McGowan JG. Optimization Algorithms for Offshore Wind Farm Micrositing, Proc. WINDPOWER 2007 Conference and Exhibition, American Wind Energy Association, Los Angeles, CA, 2007. • Zaaijer, M.B. et al, “Optimization Through Conceptial Varation of a Baseline Wind Farm”, Delft University of Technology Report, 2004. • First Wind Energy Optimization Summit, Hamburg, Feb 2009.
US Electrical Power in 2008 Other (4.1%) = Biomass (2%) + Wind (1%) + Solar + Geothermal + …
A Second Opinion… From Battelle Wind Energy Resource Atlas Viable Class 3 or above Good Class 4 or above