Download
1 / 28
280 likes | 445 Views
Galaxies: Extremely Far Starbursts?. James E. Rhoads STScI and Arizona State University Lijiang, August 19, 2005 In collaboration with Sangeeta Malhotra, JunXian Wang, Steve Dawson, Dan Stern, Arjun Dey, Buell Jannuzi, Hy Spinrad, Chun Xu, Katarina Kovac, Emily Landes, Bahram Mobasher.

E N D
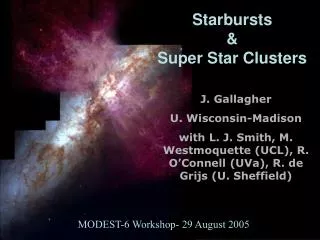
Galaxies: Extremely Far Starbursts? James E. Rhoads STScI and Arizona State University Lijiang, August 19, 2005 In collaboration with Sangeeta Malhotra, JunXian Wang, Steve Dawson, Dan Stern, Arjun Dey, Buell Jannuzi, Hy Spinrad, Chun Xu, Katarina Kovac, Emily Landes, Bahram Mobasher
Lyman α from Young Galaxies Young galaxies forming their first stars produce copious ionizing radiation, hence strong Lyman- emission.(Partridge and Peebles 1967): There are now over a dozen research groups, Over a thousand candidate Lyman- galaxies, Over a hundred spectroscopically confirmed.
Sylvain Veilleux used a picture of these pagodas in Dali to illustrate how tricky it can be to interpret our images of the universe. • Fortunately, if we take the right kind of image, at the right time, we can use it to identify the young objects.
The Narrowband Search Method • We take images in both broad and narrow filters. • Emission line sources appear faint or absent in broad filter.
The Narrowband Search Method • We take images in both broad and narrow filters. • Emission line sources appear bright in narrow filters (demand 5σ).
The Narrowband Search Method • We take images in both broad and narrow filters. • Emission line sources appear bright in narrow filters (demand 5σ). • The blue “veto filter” eliminates foreground emission line objects (demand < 2σ).
Sample Lyman- Spectra • Note prominent asymmetry. • Spectra from Dawson et al 2005, in prep; six among ~ 80 confirmed LALA z = 4.5 galaxies. • Keck+DEIMOS data. (Thanks to NSF TSIP program!!)
The Large Area Lyman Alpha Survey (LALA): an Overview Collaborators: Rhoads, Malhotra, Wang, Dey, Stern, Spinrad, Jannuzi, Dawson, Xu, Kovac, Landes z=4.5: Rhoads et al 2000; Malhotra & Rhoads 2002; Dawson et al 2004, 2005 in prep; z=5.7: Rhoads & Malhotra 2001; Rhoads et al 2003; Wang, Malhotra, & Rhoads 2004. z=6.5: Rhoads et al 2004
Lyman- Surveys A partial listing of Lyman- surveys since the first discovered field Ly- galaxies: z < 4: Hu et al 1998, Kudritzki et al 2000, Stiavelli & Scarlatta 2003, Fynbo et al, Palunas et al, 4 < z < 5: LALA; Venemans et al 2002; Ouchi et al 2002; 5 < z < 6: LALA, Hu et al 2003; Ajiki et al 2003, 2003; Wang et al 2005; Ouchi et al 2005; Santos et al 2004; Martin & Sawicki 2004; 6 < z < 7: Hu et al 2002, Kodaira et al 2003, Taniguchi et al 2004, LALA (Rhoads et al 2004), Cuby et al 2003, Tran et al 2004, Santos et al 2004, Stern et al 2005. 7 < z < 9: Several surveys in progress, no confirmed detections yet.
Physical Nature of Ly-α Galaxies • Strong Lyman-α requires copious ionizing photon production from either stars or AGN… Which? Useful diagnostics: • Equivalent width distribution. • X-ray and other multi-wavelength observations. • Detailed optical spectroscopy: Line widths; other emission lines? • Spatial correlations.
=0.5, M <120 =2.35, M <120 Equivalent Widths Equivalent widths are derived from narrow and broad-band fluxes. • Median EW ~ 240 Å. • This is the maximum for a “normal” stellar population Half the objects are “abnormal”. • Model Lyman-α equivalent width distribution: • Stellar population synthesis. • Continuum luminosity function from LBGs. • Result: Need top-heavy IMF, or low metallicity, to match observed median EW. (Malhotra & Rhoads 2002, ApJ Lett 565, L71)
X-ray Test for AGN in Ly-α Samples • We obtained two 180 ksec Chandra images of LALA fields, covering 112 Ly-α emitters. • None is detected, either individually or in a stacking analysis. • Limits: Flux < 1.2 10-17 erg cm-2 s-1 at 0.5 - 2.0 keV and < 3.9 10-17 in 0.5 -- 10.0 keV band. Soft band: left; hard band: right. 49 LALA objects in this stack. From Malhotra, Wang, et al 2003, ApJ Lett 585, L25
Lyman-α to X-ray ratios • Individual Lyman-α emitters are consistent with some but not all Type-II QSOs, and most are consistent with Seyfert IIs. • The composite Ly-α to X-ray ratio strongly rules out a large fraction of AGN in the Ly-α sample. Wang et al 2004, ApJ Letters 608, L21
Composite Ly-α Galaxy Spectrum Optical spectra show no sign of C IV or HeII lines. These would be expected for AGN. (Dawson et al 2004, ApJ 617, 707) AGN fraction < 10-20%
Spatial Distribution of Ly-α Galaxies • Lyman-α galaxy clustering has been studied by several groups: • Steidel et al identified Ly-α galaxies in an overdense region at z=3.1; • Ouchi et al find structures at z=4.8 (2003) and 5.7 (2005); • Palunas et al find a filamentary structure with an excess of large voids at z=2.4; • Venemans et al find a cluster around a z ~ 4.8 radio galaxy, and now have several more examples. • Our own: A structure at z ~ 5.9 in the Hubble Ultra-Deep Field, traced by Lyman- galaxies over 36’ (Wang et al 2005, astro-ph/0501479) and by the faintest Lyman break spectra ever (Malhotra et al 2005, astro-ph/0501478)
A Large Scale Structure at z~6 • Spatial distribution of z=5.75 galaxies in the CDF-S region. (Wang, Malhotra, & Rhoads 2005, ApJ, in print; astro-ph/0501479) • The redshift distribution of Lyman break galaxies in the Hubble UltraDeep Field shows a spike at z=5.9 ± 0.2. (Malhotra et al 2005, ApJ, in print; astro-ph/0501478)
Halo Mass and Duty Cycle • Spatial correlation length implies halo masses around 1e11 Msun.
Halo Mass and Duty Cycle • Spatial correlation length implies halo masses around 1e11 Msun. • Number counts are lower. This suggests duty cycle ~ 10%. (Kovac et al 2005)
Dust and Lyman-α Lines Dust will absorb both continuum and Ly-α photons. However there can be strongly differential absorption… • For uniform IGM, the Ly-α flux and equivalent width can be strongly suppressed. • For a sufficiently clumpy IGM, the continuum can be suppressed more than the line. • In a galactic wind, resonant scattering may be greatly reduced, and dust effects too.
Continuum photons Resonant Scattering and Dust
Lyman α photons Resonant Scattering and Dust
To Observer Continuum Photons (Neufeld 1991; Hansen & Oh 2005) Resonant Scattering in a Two Phase Medium
To Observer Lyman α Photons (Neufeld 1991; Hansen & Oh 2005) Resonant Scattering in a Two Phase Medium
Testing Radiative Transfer Scenarios We are working on two tests of radiative transfer scenarios for Lyman-α escape: • Continuum spectral slope: • Hot stellar photospheres blue starlight. • Dust scenarios reddened starlight. • Test with broad band colors-- Spitzer! • Statistical studies of Lyman-α velocity widths: • If escape is due to wind kinematics, Lyman-α strength should correlate with line profile properties.
Old Stars and Dust? • First results from Spitzer (Mobasher et al, in prep):
Old stars and dust? • SED fitting is underway for a single Ly- galaxy with deep IRAC imaging (Mobasher et al in prep). • We are also studying a sample of 150 from the LALA Bootes field, using much shallower IRAC data (Stern et al in prep). • Deeper broad band optical images will place additional constraints on dust and Ly- radiative transfer.
Lyman-α Luminosity Functions • z=5.7 luminosity function fits for three faint-end slopes, based on many surveys in the literature. • z=6.5 LF is similar. • This LF implies star formation rate density of 3e-3 Msun/yr/Mpc3, and metal production of ~ 50 Msun/Mpc3/Myr. • Similarity of z=6.5 and z=5.7 luminosity functions implies that reionization was largely complete by z=6.5. Malhotra & Rhoads 2004, ApJ Letters617, L5
Summary • Lyman-α provides an efficient way of finding high redshift, star forming galaxies. • The Lyman-α galaxies are mostly powered by star formation, not AGN. • The Lyman- galaxies have a duty cycle of ~ 10%. • Among them could be the long-sought primitive galaxies: Their properties are consistent with extreme youth. • Early Spitzer results are also consistent with relative youth, and no large “hidden” population of old stars. • Lyman-α luminosity functions show that the universe was largely ionized by z=6.5.