Download
1 / 42
420 likes | 435 Views
Dr. Hans-Wilhelm Schiffer discusses the successes and challenges of renewables deployment in the EU power sector, highlighting the high impact of renewables in every region. This lecture organized by the United States Energy Association provides valuable insights into the renewable energy landscape.

E N D
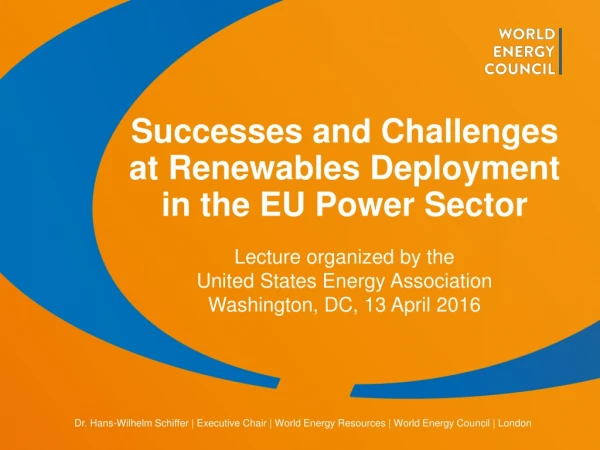
Successes and Challenges at Renewables Deploymentin the EU Power Sector Lecture organized by the United States Energy AssociationWashington, DC, 13 April 2016 Dr. Hans-Wilhelm Schiffer | Executive Chair | World Energy Resources | World Energy Council | London
Renewables: high-impact for every region Global 2016 Parameter Unit EU-28 USA Size 1,000 km² 4,383 9,832 Population million 511 321 Energy consumption Mtoe 1,610 2,290 Power generation (net) TWh 3,100 4,100 there of renewables TWh 900 562 Share of renewables in power generation % 29.0 13.7 Energy consumption per capita toe 3.2 7.1 Power generation per capita kWh 6,067 12,773 Source: German Member Committee of the World Energy Council and U.S. Energy Information Administration
Renewables: consensus for Europe and North America | World Energy Issues Monitor 2016
Share of renewable energiesin total electricity generation % EU-28 World USA
Energy mix in 2015 power production EU-28 USA Coal Other Other Hydro Gas Wind Oil Solar Nuclear Other RES* * such as biomass and geothermal energy Source: German Member Committee of the World Energy Council and U.S. Energy Information Administration
CO2 emissions in the USA, in the EU-28 and in Germany Mt USA EU-28 Change rates in %: Germany Source: 1990 – 2014: BP Statistical Review of World Energy 2015, Workbook; 2015: own estimation on the basis of the US Energy Information Administration, Short Term Energy Outlook, March 2016 (for the USA), Weltenergierat – Deutschland, Energie für Deutschland 2016 (for the EU-28) and Umweltbundesamt, March 2016 (for Germany)
Renewables policy scheme overview for the EU FIT/tender Premium CFD Quota − GC mechanism Combination of multipleschemes Suspended/expired New legislation pending/ under consultation Source: EU-Commission and other sources
Share of renewable energies in total electricity supplyin the EU countriesin % 2004 2014
Main motives for the national energy transition Cost minimization Reduction of the share of nuclear energy Energy efficiency Extension Renewable energy Climate Mitigation EU-28 Germany France United Kingdom Sweden Source: Estimate on the basis of discussions with representatives of the respective countries
Energy transition – Energiewende • In 2010 the German government decided on a lifetime extension of nuclear power plants to build a bridge to a low-carbon economy. • Fukushima was a turning point. • Consequences: • Phase-out of nuclear energy in parallel with a • conversion from a fossil-based to a renewables-based energy supply and a • concurrent reduction in energy consumption via increased energy efficiency • Three motives: • Climate mitigation • Finiteness and external effects of fossil resources • Risks of nuclear energy
Central elements of the German Energiewende Reduction in GHG emissions by 40% by 2020 and 80 to 95% by 2050 – compared with 1990 level (2015: reduction of 27% compared to 1990) Increase in the share of renewable energy in total energy con-sumption to 30% in 2030 and 60% in 2050 (share in 2015: 13%). Increase in the share of renewable energy in total power con-sumption to 50% in 2030 and 80% in 2050 (share in 2015: 33%) Complete nuclear phase-out by the end of 2022 Improved energy efficiency: Halving the primary energy consumption by 2050 compared with 2008 level The project is based on the assumption that a highly industrialized society can be securely and competitively supplied by a generation system based predominantly on RES
Promotion of green electricity by Renewable Energy Sources Act (EEG) Guaranteed feed-in payments for green electricity for 20 years after commissioning the plant concerned Grid operators are obliged to immediately and as a priority purchase the entire quantity of green electricity offered The plant operator is paid the EEG feed-in tariff by the local grid company; the four German transmission system operators are in charge of selling this electricity at the (usually lower) market price via the power exchange The trading companies pass on the deficit (feed-in tariff minus market price) to consumers by imposing an EEG reallocation charge
Installed capacity for power generation in Germany on the basis of renewables GW 95 90 83 77 Solar PV Average annual increase: 15 % 66 56 48 40 36 33 Wind 29 26 22 19 15 12 Biomass Hydro Source: AGEE-Stat und BDEW, February 2015 and Bundesnetzagentur
Average Price for PV Rooftop Systems in Germany (10kWp – 100 kWp) Average Price (€/kWp) 6000 BOS incl. Inverter Modules 5000 4000 3000 2000 1300 €/kWp 1000 Percentage of the Total Cost 0 2006 2007 2008 2009 2010 2011 2012 2013 2014 15 Year Data: BSW-Solar, Graph: PSE AG 2015
Share of renewables in meeting electricity demand and total volume of EEG support charge Share of RES in % Promotional charge in €bn 27%-point increase over 1999 – funding provided to this end by electricity consumers between 2000 and 2015: approx. €125bn
Development of wholesale prices for electricity in Germany and EEG reallocation charge EUR/MWh Wholesale electricity prices (base load) EEG reallocation charge Position: January 2016 Source: Transmission system operators' transparency platform
France‘s „pragmatic“ energy transition The law (adopted in July 2015) has six main objectives To reduce greenhouse gas emissions by 40% in 2030 compared to 1990 To decrease fossil fuel consumption by 30% in 2030 compared to 2012 To increase the share of renewable energy in final energy consumption to 32% and in electricity generation to 40% in 2030 To reduce final energy consumption by 50% in 2050 compared to 2012 To diversify electricity generation, including reducing the share of nuclear energy to 50%, in 2025 To decrease waste in landfills by 50% in 2050 The law enjoys broad acceptance throughout society.
The dilemma of European energy policy Legal basis: Article 194, Treaty on the Functioning of the EU • Aims of the Union policy on energy: • Ensure the functioning of the energy market; • Ensure security of energy supply in the Union • Promote energy efficiency and energy saving, and the development of new and renewable forms of energy • Promote the interconnection of energy networks • European Parliament and Council shall establish the measures necessary to achieve these objectives • However: „Such measures shall not affect a Member State‘s right to determine the conditions for exploiting its energy resources, its choice between different energy sources and the general structure of its energy supply (…)“ EU RES target of 20% until 2020 and 27% until 2030 Structural tension between national and EU level Energy Mix is Member States‘ choice
Energy mix in ten of the 28 EU member states 2014 in % Lignite Hard coal Nuclear energy Gas Renewables Other Source: IEA, Electricity Information 2015
Overview: EU Climate and Energy PolicyNew targets for 2030 were set in October 2014 + • Only GHG reduction target will be translated into national binding targets • Renewables and efficiency targets are EU-level targets • Energy efficiency target is only indicative • New governance structure to coordinate EU and national policies transparency, predictability, regional cooperation
2030 framework for the European power sector GHG emission reduction by 40%compared with 1990 emission levels Climate target Emission reduction of 43% by 2030 compared with 2005 emission levels for sectors which are part of the ETS (power sector and industry) Emission reduction of 30% by 2030 compared with 2005 emission levels for sectors which are not part of the ETS (households, traffic) ETS = Emission Trading Scheme Increase in the share of renewable energy in power generation from 21% in 2012 to 45% in 2030 Expectation for the power sector
Impact of COP21 on EU climate policy The EU as frontrunner!? • EU and its Member States submitted its Nationally Determined Contribution of an at least 40 % domestic reduction in green-house gas emissions by 2030 compared to 1990, to be fulfilled jointly • but also wants a mechanism for all UN parties to review and possibly increase targets in 2025 What will come after COP21?? • The climate agreement, deposited at the UN in New York, will be opened for one year for signature on 22 April 2016 – High Level signing ceremony on Mother Earth Day in New York • Debate on ETS reform will gear up – fundamentals could be questioned • The so-called effort sharing has to be decided • contribution of each Member State for the non-ETS sectors in the form of national binding targets • 2030 framework foresees variation from 0 - 40 % emission reduction
Price setting for electricity on the wholesale market – principle in central Europe Demand (load) Euro/MWh Natural gas was the price setting fuel Market price pold Hard coal sets the price Market price pnew with extended use of renewables MW Renewable energy Nuclear energy Lignite Hard coal Natural gas Oil
Forward wholesale power prices in Germany for the year that follows Ø-price reduction in % from 2010 to 2015 €/MWh peakload - 40% - 38% baseload - 37% offpeak 2004 2005 2006 2007 2008 2009 2011 2014 2015 2010 2012 2013
Clean Dark and Clean Spark Spread (Margins of gas- and hard coal-fired power plants)Based on prices for the year that follows 2008 2009 2011 2010 2007 2012 2013 2014 2015 CSS= clean spark spread (peak load electricity price minus cost of natural gas and CO2 determined for the year that follows) CDS= clean dark spread (base load electricity price minus cost of hard coal and CO2 determined for the year that follows)
Electricity Consumption and Generation in Germany on 23 August 2015 GW electricityconsumption conventional power plants solar wind run-of-river biomass Source: Agora Energiewende: Agorameter, www.agora-energiewende.de
Electricity Consumption and Generation in Germany on 3 November 2015 GW electricityconsumption conventional power plants solar wind run-of-river biomass Source: Agora Energiewende: Agorameter, www.agora-energiewende.de
The biggest drawback of renewables: Their availability is not in our hands Solar At times, wind and solar power meet more than three-quarters of electricity demand … Wind Gigawatt 25 … while at others they all but vanish from the scene Conventional power plants are needed to ensure security of supply 15 But the expansion of renewables leads to conventional power plants becoming increasingly unprofitable
Requirements for conventional power plants regarding flexibility/ operation will change seriously In Future Previously • Baseload power plants • Intermediate load plants • Peakload power plants • High efficiency at maximum load • Similar requirements for all fuels/plant types • Design for many load changes • High ramp-rates • Low minimum load • Economic operation even at low number of operating hours Security of supply
Power generation capacity in Germany GW (net) 258.5 218.7 199.2 Renewable energy Conventional power plants Source: Bundesnetzagentur, January 2016 (Status 10/11/2015) and 2015 Electricity Grid Development Plan, scenario B
Interconnection capacities compared to the total capacity installed within the EU-28 Source: ENTSO-E via European Commission Communication "Achieving the 10% electricity interconnection target" (COM(2015) 82).
Electric energy flows between Germany and neighbouring countries in 2015 (*) Germany is the electricity market's hub in Europe DENMARK SWEDEN in TWh 1,9 5,1 Mit den Importen und Exporten im Strommarkt von 112 Mrd. kWh liegt Deutschland im Jahr 2006 europaweit an der Spitze. 2,9 0,2 NETHERLANDS 10,7 0,02 ∑ Import 33,5 ∑ Export 85,2 0,3 POLAND 24 GERMANY BELGIUM 6,3 6,1 LUXEMBOURG 6,1 CZECHREPUBLIC 1,4 1,4 16,1 FRANCE 12,1 17,8 3,5 AUSTRIA 3,0 SWITZERLAND Source: BDEW, status: 1.3.2016, (*) preliminary
Breakdown of total household price in 2014 €/MWh Energy & Supply Network Taxes & PSCs Source: Eurelectric, February 2016
Evolution of Policy Support Costs (PSCs) elements in the EU-28 power prices for households €/MWh . . . . . . . . . . . Source: Eurelectric, February 2016
Electricity prices for industry and households 2015Figures in USD/MWh Industry Private households Germany Japan Norway* USA OECD total Germany Japan Norway USA OECD total * Prices for the second quarter 2015 Source: IEA, Energy Prices and Taxes, fourth quarter 2015, Paris 2016, p. 343 and 344
Conclusion – Lessons Learnt (1) General aspects including impacts for conventional energies • The energy transition should not be limited to the power sector but also include the cooling/heating market, industry and transportation. • Further electrification is the key for a successful reshaping of the energy supply. • A diversified energy mix should be given preference over one-sided arrangements. • As far as conventional energy sources are concerned, one should rely on least-cost solutions. • Whether preference is given to coal, gas or nuclear energy should be a rational decision – taking into account the central targets of energy policy such as security of supply, competitiveness and environmental protection. • With respect to climate change mitigation, CC(U)S should be seen as an important option besides energy efficiency and renewable energies.
Conclusion – Lessons Learnt (2) Governance of the penetration of renewable energies • In providing incentives for investment in renewable energies one should avoid impairing the market system. • The fast penetration of renewable-based power generation in Germany has produced a strong learning curve effect, especially in the case of solar PV. • The effects on employment as regards the construction of solar panels are concentrated in China but the share of domestic service providers in total installation costs has increased. • A renewable-energy promotion system which is based on "produce and forget" with long-term guaranteed margins for investors is not a sustainable solution in the long run. It is only appropriate at the very starting point. • The system has led to a skyrocketed increase in particular in PV installation which exceeded the expectations and targets.
Conclusion – Lessons Learnt (3) Infrastructure aspects • The renewable-energy promotion system applied in Germany has caused disparities between the locations of generation and the demand centres – wind is one example. • The necessary extension of the grid system should go hand in hand with the expansion of renewables-based generation plants. • Another Lesson Learnt: It can be appropriate to adjust the promotion system in a way that generation takes place where the power is needed. • Tender systems can be seen as an adequate instrument in order to ensure that the dimension and the location of the investment are in line with policy targets and power system requirements. • Checking the option of the installation of storage in the distribution grid versus an investment in the extension of the grid system
Conclusion – Lessons Learnt (4) Adaptation of the Market Design • Despite the massive increase in renewable-based power generation, conventional power plants are still needed on nearly the same scale as before in order to cover demand when the wind does not blow sufficiently and the sun does not shine. • The necessary operational flexibility of coal- and gas-fired power plants can be achieved, but conventional plant operators face considerably reduced revenues as a result of the expansion of intermittent renewables. • Experience in the EU: The existing "energy-only-market" is not sufficient any more to guarantee security of supply. An additional capacity market is necessary in order to ensure security of supply in the long run. • Using the instrument of market prices (setting the right price signals) in order to achieve load adjustments.