Download
1 / 34
340 likes | 357 Views
This dissertation proposal explores the biogeochemical factors influencing the burial of phosphorus in wetland soils, with a focus on soil organic matter and its effect on phosphorus stability. The study aims to characterize soil organic phosphorus fractions and their distribution over time, as well as investigate the coupling of biogeochemical transformations to long-term phosphorus burial.

E N D
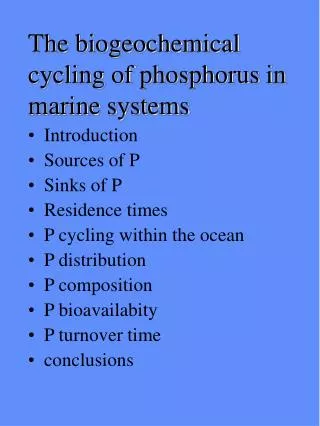
BiogeochemicalControls Regulating Long-term Burial of Phosphorus in Wetland Soils M. M. Fisher Dissertation Proposal November 5, 2004
Source of Impairment to US Waters 16 14 12 10 8 % of All Impairments 6 4 2 0 SALINITY pH DO FISH METALS NUTRIENTS HABITAT THERMAL TURBIDITY SILTATION PESTICIDES UNKNOWN PATHOGENS BIOLOGICAL SUSPENDED SOLIDS FLOW ALTERATION Background 40% of US Surface Waters Impaired Source: 1998 USEPA 303d List of Impaired Waters
Florida: Nutrient Impairment • 35% of large lakes do not meet designated use due to excess nutrients Source: Integrated Water Quality Assessment for Florida: 2004 305(b) Report and 303(d) List Update.
Nutrients, Legislation, and Restoration • Eutrophication leads to: • 1. undesirable changes in flora and fauna; algal blooms, fisheries impacts. • 2. for wetlands: changes in primary producers to higher nutrient status plants such as cattails; loss of diversity. • Restoration of aquatic ecosytems req’d. by 1972 Clean Water Act to fishable & swimmable condition.
Establishing Restoration Targets • Meet FDEP surface water criteria (TSI) • Reference lake/wetland approach • Historical anecdotal information: • status of the fishery • extent of submerged aquatic vegetation • water clarity • Investigate the soil/sedimentary record (paleolimnolgy)
Lake Okeechobee, Florida Sediment Depth, cm Sediment TP, mg/kg Source: Engstrom and Brezonik. 1998. Modern and historic accumulation rates of phosphorus in Lake Okeechobee sediments. J. Paleolimn. 20:31-46.
Lake Erken, Sweden Source: Rydin, E. 2000. Potentially mobile P in Lake Erken sediments. Water Res. 34:2037-2042.
Typical sediment nutrient profile water soil Depth (or time) Concentration
Peat Soil Phosphorus: Predominately Organic Blue Cypress Marsh 1,000 TPo = 0.89*TP -49 800 TPo (mg kg-1) 600 NE NW SW 400 400 600 800 1000 TP (mg kg-1)
Hypothesis • H1: Changes in soil phosphorus fractions, with respect to depth (time) are principally due to biogeochemical changes in soil organic matter (SOM). • Ho: Changes in phosphorus fractions, with respect to depth (time) are principally due to other factors such as changes in phosphorus loading rates.
Objectives • Determine the distribution of soil organic P (SOP) fractions, as a function of depth, or time. • Characterize SOM fractions, as a function of depth, or time. • Coupling of biogeochemical transformations of SOP and SOM pools to stability and long-term burial
Study Locations Blue Cypress Marsh Conservation Area (BCMCA) Water Conservation Area 2A (WCA2A)
StudyLocation: Blue Cypress Marsh Conservation Area Size = 120 km2 Histosols, 1 - > 5 m Sawgrass, maidencane, slough Soft water, pH 6.5 Pristine Impacted
StudyLocation: Water Conservation Area 2A Size = 447 km2 Histosols, 1 - 2 m Sawgrass, slough, tree islands Calcareous Impacted Pristine
Experimental MethodsSoil O-P Fractionation Experiment IPhosphorus Fractionation Experiment IIAutoclave Extraction (0.5 g, 90 min, 128C) Experiment IIIPotentially Mineralizable organic P (0.5 g, anaerobic, 10d, 40C) Experiment IVThermal Extraction
Depth Distribution of Total Phosphorus 0 -20 -40 -60 WCA2A (E5) BCMCA (B4) -80 -100 -120 -140 -160 0 400 800 TP, mg/kg
Experiment I: Organic P Fractionation(0-50 cm, unimpacted sites) BCMCA WCA2A 3% Bicarb-Pi 9% 25% 23% 9% HCl-Pi 36% FAP HAP Res. P 29% 21% 28% 17% TP = 327 mg/kg TP = 197 mg/kg
Autoclave extraction[HEP = Hot water extractable P] Impacted Unimpacted 0 -20 -40 BCMCA -60 WCA2A Depth, cm -80 -100 -120 -140 0 40 80 0 40 80 HEP, % of TP
Thermal P ExtractionBCMCA 100 80 0-10 cm 40-50 cm 90-100 cm) 60 % of TP 40 20 0 160 200 260 300 360 550 160 200 260 300 360 550 160 200 260 300 360 550 Temperature, C
Everglades & Blue Cypress MarshCarbon : Nitrogen Ratio 0 -20 -40 -60 BCMCA Depth, cm -80 WCA2A -100 -120 -140 0 10 20 30 40 C:N
WCA2A BCMCA Everglades & Blue Cypress MarshCarbon : Phosphorus Ratio 0 -20 -40 -60 Depth, cm -80 -100 -120 -140 0 4000 8000 C:P
Preliminary Conclusions BCMCA historically higher nutrient status marsh. Thermal techniques indicate increasing O-P stability.
Experimental MethodsCharacterize SOM (BCMCA) Experiment IOM fluorescence Experiment IIE4:E6 Experiment IIIIsotope analysis: 13C , 15N, 14C (ecosystem history, transformation rates) Experiment IV13C-NMR (broad classes of SOM) Experiment VLignin, cellulose, hemicellulose
Preliminary Results: OM Characterization
Plant tissue Detritus 0 -20 -40 -60 Depth, cm -80 -100 -120 -140 0 2 4 6 8 10 12 HIX Experiment I: Humification Index
+MW +fulvic +humic Experiment II: E4 E6 Ratio 0 -20 -40 B4 C1 -60 -80 -100 -120 -140 0 2 4 6 8 10 14 E4:E6
Preliminary Conclusions Increased humic characteristics of SOM extracts with respect to depth. Slight increase in apparent molecular weight of SOM extracts with respect to depth.
Model: SOP Diagenesis Depth Time SOP Humic character Recalcitrance
“In paleolimnology...diagenesis is at best an annoyance and at worst a nightmare, weakening nearly every generalization that investigators may wish to make” (Binford, Deevey, and Crisman, 1983, Paleolimnology: an historical perspective on lacustrine ecosystems)
Wet soil 0.5M NaHCO3 16 hrs 1M HCL 3 hrs Sequential O-P Fractionation 0.5M NaOH 16 hrs Separate into fulvic and humic fractions Wet soil residue Ivanoff, D.B., K.R. Reddy, and S. Robinson. 1998. Chemical fractionation of organic phosphorus in selected Histosols. Soil Science. 163:36-45.
S 435 480 300-345 S Example: Fluorescence Increased absorbance: red-shift 500 400 300 Fluorescence Intensity 200 100 0 250 350 450 550 650 Wavelength, nm Humification Index (HIX) =
Pyrolysis Extraction Inert atmosphere 160, 200, 260, 300, 360, 550 oC Batch loaded 1 hour combustion Extract w/ 1M HCl
E4:E6 17 hr, 0.5 M NaOH Extract Absorb. 445 & 465 Ratio is related to molecular weight Chen, Y., N. Senesi, and M. Schnitzer. 1977. Information provided on humic substances by E4/E6 ratios. Soil Sci. Soc. Am. J. 41:352-358