Download
1 / 112
1.14k likes | 1.25k Views
Quality of Service (QoS). Shivkumar Kalyanaraman Rensselaer Polytechnic Institute shivkuma@ecse.rpi.edu http://www.ecse.rpi.edu/Homepages/shivkuma. Based in part on slides of Ion Stoica, Jim Kurose, Srini Seshan, Srini Keshav. Why better-than-best-effort (QoS-enabled) Internet ?

E N D
Quality of Service (QoS) Shivkumar Kalyanaraman Rensselaer Polytechnic Institute shivkuma@ecse.rpi.edu http://www.ecse.rpi.edu/Homepages/shivkuma Based in part on slides of Ion Stoica, Jim Kurose, Srini Seshan, Srini Keshav
Why better-than-best-effort (QoS-enabled) Internet ? • Quality of Service (QoS) building blocks • End-to-end protocols: RTP, H.323 • Network protocols: • Integrated Services(IntServ), RSVP. • Scalable differentiated services: DiffServ • Control plane: QoS routing, traffic engineering, policy management, pricing models Overview
Why Better-than-Best-Effort (QoS)? • To support a wider range of applications • Real-time, Multimedia, etc • To develop sustainable economic models and new private networking services • Current flat priced models, and best-effort services do not cut it for businesses
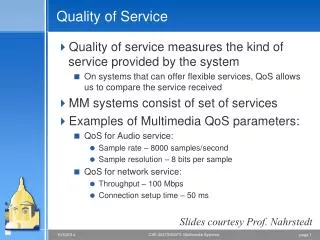
QoS network provides application with level of performance needed for application to function. Quality of Service: What is it? Multimedia applications: network audio and video
What is QoS? • “Better performance” as described by a set of parameters or measured by a set of metrics. • Generic parameters: • Bandwidth • Delay, Delay-jitter • Packet loss rate (or loss probability) • Transport/Application-specific parameters: • Timeouts • Percentage of “important” packets lost
What is QoS (contd) ? • These parameters can be measured at several granularities: • “micro” flow, aggregate flow, population. • QoS considered “better” if • a) more parameters can be specified • b) QoS can be specified at a fine-granularity. • QoS spectrum: Best Effort Leased Line
FIFO Scheduling Discipline B B Fundamental Problems • In a FIFO service discipline, the performance assigned to one flow is convoluted with the arrivals of packets from all other flows! • Cant get QoS with a “free-for-all” • Need to use new scheduling disciplines which provide “isolation” of performance from arrival rates of background traffic
Fundamental Problems • Conservation Law (Kleinrock):(i)Wq(i) = K • Irrespective of scheduling discipline chosen: • Average backlog (delay) is constant • Average bandwidth is constant • Zero-sum game => need to “set-aside” resources for premium services
QoS Components • QoS => set aside resources for premium services • QoS components: • a) Specification of premium services: (service/service level agreement design) • b) How much resources to set aside? (admission control/provisioning) • c) How to ensure network resource utilization, do load balancing, flexibly manage traffic aggregates and paths ? (QoS routing, traffic engineering)
QoS Components (Continued) • d) How to actually set aside these resources in a distributed manner ? (signaling, provisioning, policy) • e) How to deliver the service when the traffic actually comes in (claim/police resources)? (traffic shaping, classification, scheduling) • f) How to monitor quality, account and price these services? (network mgmt, accounting, billing, pricing)
How to upgrade the Internet for QoS? • Approach: de-couple end-system evolution from network evolution • End-to-end protocols: RTP, H.323 etc to spur the growth of adaptive multimedia applications • Assume best-effort or better-than-best-effort clouds • Network protocols: IntServ, DiffServ, RSVP, MPLS, COPS … • To support better-than-best-effort capabilities at the network (IP) level
QOS SPECIFICATION, TRAFFIC, SERVICE CHARACTERIZATION, BASIC MECHANISMS
Service Specification • Loss: probability that a flow’s packet is lost • Delay: time it takes a packet’s flow to get from source to destination • Delay jitter: maximum difference between the delays experienced by two packets of the flow • Bandwidth: maximum rate at which the soource can send traffic • QoS spectrum: Best Effort Leased Line
Hard Real Time: Guaranteed Services • Service contract • Network to client: guarantee a deterministic upper bound on delay for each packet in a session • Client to network: the session does not send more than it specifies • Algorithm support • Admission control based on worst-case analysis • Per flow classification/scheduling at routers
Soft Real Time: Controlled Load Service • Service contract: • Network to client: similar performance as an unloaded best-effort network • Client to network: the session does not send more than it specifies • Algorithm Support • Admission control based on measurement of aggregates • Scheduling for aggregate possible
Traffic and Service Characterization • To quantify a service one has two know • Flow’s traffic arrival • Service provided by the router, i.e., resources reserved at each router • Examples: • Traffic characterization: token bucket • Service provided by router: fix rate and fix buffer space • Characterized by a service model (service curve framework)
Token Bucket • Characterized by three parameters (b, r, R) • b – token depth • r – average arrival rate • R – maximum arrival rate (e.g., R link capacity) • A bit is transmitted only when there is an available token • When a bit is transmitted exactly one token is consumed r tokens per second bits slope r b*R/(R-r) b tokens slope R <= R bps time regulator
Characterizing a Source by Token Bucket • Arrival curve – maximum amount of bits transmitted by time t • Use token bucket to bound the arrival curve bps bits Arrival curve time time
(b=1,r=1,R=2) Example • Arrival curve – maximum amount of bits transmitted by time t • Use token bucket to bound the arrival curve Arrival curve bits 4 bps 3 2 2 1 1 0 1 2 3 4 5 1 2 3 4 5 time size of time interval
d Per-hop Reservation • Given b,r,R and per-hop delay d • Allocate bandwidth ra and buffer space Ba such that to guarantee d slope ra slope r bits Arrival curve b Ba
“external process” What is a Service Model? • The QoS measures (delay,throughput, loss, cost) depend on offered traffic, and possibly other external processes. • A service model attempts to characterize the relationship between offered traffic, delivered traffic, and possibly other external processes. Network element delivered traffic offered traffic (connection oriented)
Rin Rout Network Element Arrival and Departure Process bits Rin(t) = arrival process = amount of data arriving up to time t delay buffer Rout(t) = departure process = amount of data departing up to time t t
Traffic Envelope (Arrival Curve) • Maximum amount of service that a flow can send during an interval of time t b(t) = Envelope slope = max average rate “Burstiness Constraint” slope = peak rate t
Service Curve • Assume a flow that is idle at time s and it is backlogged during the interval (s, t) • Service curve: the minimum service received by the flow during the interval (s, t)
Rout(t) Big Picture Service curve bits bits Rin(t) slope = C t t bits t
Delay and Buffer Bounds bits E(t) = Envelope Maximum delay Maximum buffer S(t) = service curve t
Mechanisms: Traffic Shaping/Policing • Token bucket: limits input to specified Burst Size (b) and Average Rate (r). • Traffic sent over any time T <= r*T + b • a.k.a Linear bounded arrival process (LBAP) • Excess traffic may be queued, marked BLUE, or simply dropped
Mechanisms: Queuing/Scheduling Traffic Sources Traffic Classes • Use a few bits in header to indicate which queue (class) a packet goes into (also branded as CoS) • High $$ users classified into high priority queues, which also may be less populated => lower delay and low likelihood of packet drop • Ideas: priority, round-robin, classification, aggregation, ... $$$$$$ Class A $$$ Class B $ Class C
Mechanisms: Buffer Mgmt/Priority Drop • Ideas:packet marking, queue thresholds, differential dropping, buffer assignments Drop RED and BLUE packets Drop only BLUE packets
Packet Scheduling • Decide when and what packet to send on output link • Usually implemented at output interface flow 1 Classifier flow 2 Scheduler 1 2 flow n Buffer management
Focus: Scheduling Policies • Priority Queuing: classes have different priorities; class may depend on explicit marking or other header info, eg IP source or destination, TCP Port numbers, etc. • Transmit a packet from the highest priority class with a non-empty queue • Preemptive and non-preemptive versions
Scheduling Policies (more) • Round Robin: scan class queues serving one from each class that has a non-empty queue
Round-Robin Discussion • Advantages: protection among flows • Misbehaving flows will not affect the performance of well-behaving flows • Misbehaving flow – a flow that does not implement any congestion control • FIFO does not have such a property • Disadvantages: • More complex than FIFO: per flow queue/state • Biased toward large packets – a flow receives service proportional to the number of packets
Generalized Processor Sharing(GPS) • Assume a fluid model of traffic • Visit each non-empty queue in turn (RR) • Serve infinitesimal from each • Leads to “max-min” fairness • GPS is un-implementable! • We cannot serve infinitesimals, only packets
Generalized Processor Sharing • A work conserving GPS is defined as • where • wi – weight of flow i • Wi(t1, t2) – total service received by flow i during [t1, t2) • W(t1, t2) – total service allocated to all flows during [t1, t2) • B(t) – number of flows backlogged
Fair Rate Computation in GPS • Associate a weight wiwith each flow i • If link congested, compute f such that f = 2: min(8, 2*3) = 6 min(6, 2*1) = 2 min(2, 2*1) = 2 8 (w1 = 3) 10 4 6 (w2 = 1) 4 2 2 (w3 = 1)
Bit-by-bit Round Robin • Single flow:clock ticks when a bit is transmitted. For packet i: • Pi = length, Ai = arrival time, Si = begin transmit time, Fi = finish transmit time • Fi = Si+Pi = max (Fi-1, Ai) + Pi • Multiple flows:clock ticks when a bit from all active flows is transmitted round number • Can calculate Fi for each packet if number of flows is known at all times • This can be complicated
Packet Approximation of Fluid System • Standard techniques of approximating fluid GPS • Select packet that finishes first in GPS assuming that there are no future arrivals • Important properties of GPS • Finishing order of packets currently in system independent of future arrivals • Implementation based on virtual time • Assign virtual finish time to each packet upon arrival • Packets served in increasing order of virtual times
Fair Queuing (FQ) • Idea: serve packets in the order in which they would have finished transmission in the fluid flow system • Mapping bit-by-bit schedule onto packet transmission schedule • Transmit packet with the lowest Fi at any given time • Variation: Weighted Fair Queuing (WFQ)
Fluid GPS system service order Weighted Fair Queueing select the first packet that finishes in GPS Approximating GPS with WFQ 0 2 4 6 8 10
Output Flow 1 Flow 2 F=10 F=8 F=5 Flow 1 (arriving) Flow 2 transmitting Output F=10 F=2 FQ Example Cannot preempt packet currently being transmitted
FQ Advantages • FQ protect well-behaved flows from ill-behaved flows • Example: 1 UDP (10 Mbps) and 31 TCP’s sharing a 10 Mbps link
System Virtual Time: V(t) • Measure service, instead of time • V(t) slope – rate at which every active flow receives service • C – link capacity • N(t) – number of active flows in fluid system at time t V(t) time Service in fluid flow system 1 2 3 4 5 6 1 2 3 4 5 time
System Virtual Time • Virtual time (VGPS) – service that backlogged flow with weight = 1 would receive in GPS
Service Allocation in GPS • The service received by flow i during an interval [t1,t2), while it is backlogged is
Virtual Time Implementation of Weighted Fair Queueing • ajk – arrival time of packet k of flow j • Sjk– virtual starting time of packet k of flow j • Fjk– virtual finishing time of packet k of flow j • Ljk– length of packet k of flow j if session j backlogged if session j un-backlogged
Virtual Time Implementation of Weighted Fair Queueing • Need to keep per flow instead of per packet virtual start, finish time only • System virtual time is used to reset a flow’s virtual start time when a flow becomes backlogged again after being idle
System Virtual Time in GPS 1/2 1/8 1/8 1/8 1/8 2*C C 2*C 0 4 8 12 16