Download
1 / 35
350 likes | 480 Views
Ch8 Cumulative-Sum and Exponentially Weighted Moving-Average Control Charts. Shewhart control chart : 只用在最後畫的點關於 process 的資訊,但忽略 entire sequence of points 所透露的訊息。 使其對 small shift ( e.g. 1.5-sigma )非常 insensitive 。 加入 supplemental sensitizing rules 雖可提高其

E N D
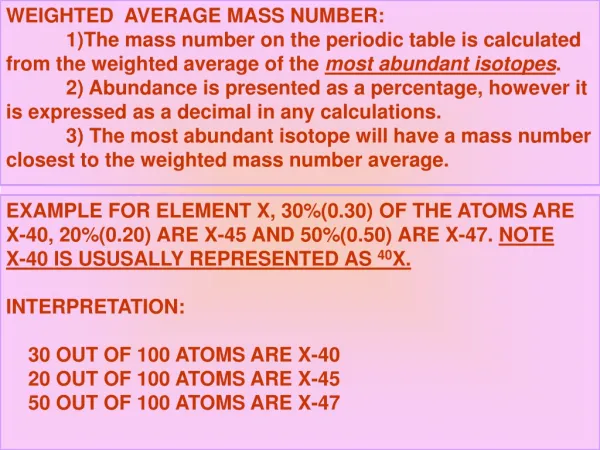
Ch8 Cumulative-Sum and Exponentially Weighted Moving-Average Control Charts • Shewhart control chart:只用在最後畫的點關於 • process的資訊,但忽略entire sequence of points • 所透露的訊息。 • 使其對small shift(e.g. 1.5-sigma)非常insensitive。 • 加入supplemental sensitizing rules雖可提高其 • power,但都也使其不易解釋Shewhart C.C.。
兩種detect small shift的有效方法: • 1. Cumulative sum control chart • 2. Exponentially weighted moving average C.C. • 舉例說明Shewhart C.C.對shift的大小(≦1.5 sigma) • 的detect是不effective。 • 見附表1及附圖。 • 對於small shift(≦1.5-sigma),可考慮cumulative- • sum control chart。
Page(1954)提出:Cusum(random walk with mean 0) • Cusum的C.C.對n=1時,特別effective! • 在此章,我們著重於process mean的cusum,但亦可將之 • 推廣到Poisson、Binomial、甚至standard deviation,及 • ranges。
當in control, 隨機地在0點附近fluctuate。 • 若 ,則 有向上的趨勢。 • 若 ,則 有向下的趨勢。 • 考慮前面的例子:(如附圖)
n=1,individual observation • 假設 為已知(或可估計) • 為“target” value • 當process drift或shifts off此target value時,cusum會 • 顯示signal,此時應試圖調整一些可操作的變數(e.g. • 加入觸媒的速度),使process back on target,或尋 • 找是否有assignable cause存在。
Tabular Cusum的建法: 若 或 超過H(decision interval)時,則視為out of control。其中一般取 。 見附表2
假設target value ,sample size n=1 Example 1 資料見附表1,假設要detect 見附表2及附圖。
當process 產生shifts 之後,我們可利用下面的 • 方式來求新process的mean,藉此可協助決定如 • 何調整manipulatable variable,以將process的 • mean調回原來的target value 。
Runs tests或Zone rule或其他的sensitizing rule均不適用 • 於cusum(∵並不獨立)。 • Cusum亦可視為一種weight average,其weight average • 為stochastic或random。 • e.g. Example 1中, , • 給最後 個observations equal weight, • 給其他的observation weight zero。 • Example 1的應用。
當process的shift大約為 時,取 ,h=4 or 5, • ,k=1/2,可有較好的ARL性質。 當 shift= 時,我們可選擇k,使得其out of control的ARL 最小。 • Cusum Design:決定reference value K and decision • interval H(通常是由ARL來決定)。 • 見附表3,k=1/2,h=4、5時的ARL。 • 附表4中,( h , k )使得其in control的ARL與Shewart相同,
當 ,則可以上式來approximate 當 ,則可以上式來approximate • Siegmund’s approximation(1985)of the ARL for a one- • sided cusum:
其中A=第一個( )的事件 B=第一個( )的事件 • ARL of the two-sided cusum:
(與附表3中的ARL的真值(465)十分接近) (與附表3中的ARL的真值(4.01)亦十分接近) • 其他求ARL的方法可參照課本。
通常在Shewhart chart,使用n>1時,會improve • control chart的表現,然而對Cusum chart,通常 • 則以n=1的表現較佳。 e.g.n=1,每半小時取樣 n=5,每2.5小時取樣 此兩種方法若對Cusum而言,則以n=1、每半小時 取樣的效果較佳。 因而除非有充分經濟上的考量或其他明確的理由, 在使用Cusum chart時,我們偏向於採用n=1的情況。
The Standardized Cusum 先將variable 標準化,令 兩大優點:1. h與k的選擇將與 無關。 2. 便於造Control variability的Cusum。 • 上述建立n=1時的Cusum方法,亦可廣於n>1的情 • 況,僅須將 以 取代, 以 取代之。
改進之道:在線上(on-line)採用 • combined Cusum-Shewhart procedure • 其中Shewhart control limits設為 • center line(或target value) 。 • Cusum或Shewhart的out of control signal均視為 • 一個action signal。 • Cusum chart對detect small shift是十分有效率的, • 但對large shift卻不如Shewhart chart的有效。 • 見附表5(a)、(b)。 • Fast initial Response(by Lucas & Crosier(1982)or • Headstart) • 此法是用來改進Cusum在process start-up時的sensitivity。
令 及 (稱為50 percent headstart) • 1. 當process is in control,Cusum的點亦會很快的回 • 歸到零(即擺脫掉此initial effect!) • 2. 當process is out of control, Cusum的點則會較快 • 的超出H。 e.g. 附表6、附表7。
※注意在附表5 column (c)的Cusum with FIR的ARL 是當process is out of control所求得。若process一開 始是 in control,則其 或 很快就會歸零,此後 若process才out of control,則其計算ARL的方法仍應 採用附表5的column (a),而非column(c)。但若 process一開始即是out of control,則其計算ARL的方 式仍是採用column (c)。 • 見附表5 column (c),採用50 percent headstart。
當 (target value)是必須馬上被detect,但 • 則無所謂時,即可採用one-sided Cusum。 • 或 及 是有其不同的重要性,則可設計 • Cusum使其在upper及lower side有不同的sensitivity。
Cusum for Monitoring Process Variability 令 ,此統計量對variance change比 對mean change更sensitive。(事實上對兩者均sensitive)。
當process是in control, approximately N(0,1) • distributed,故可以下法來建造其two-sided • standardized scale Cusum: 其中 (但若使用FIR,其值可不為零。) 若process的standard deviation減少時, 會增加且超過h。 當process的standard deviation增加時, 亦會增加且超過h。 • Scale Cusum的解釋方式與mean的Cusum相同:
Hawkins(1993)建議,將Scale Cusum及mean的 • Cusum畫在同一個圖上,有助於從Scale Cusum來 • detect process variability的改變能力。 • 若Scale Cusum signal,則可suspect variance發生 • 改變。 • 若mean Cusum與Scale Cusum同時發生改變,則應 • suspect mean發生改變。
其中k為reference value, = 從上次觀察到的count到此次count的時間。 • 對於count data且其count rate非常低時,使用cusum特 • 別有效用(e.g. 在fraction nonconforming非常低時 • (可以ppm計)),此時可採用between events的時間 • (e.g. 偵測到不良品的經過時間),當做quality • characteristic建立time-between-events cusum來detect • count rate是否增加了,此等價於detect time between • events是否decrease了,其cusum scheme如下:
另外亦可採用transformation的方法,將 先轉換 • 成approximately normal的r.v.’s,再使用建立mean • cusum的方法。 • The V-mask Procedure(skip)。
The Exponentially Weight Moving-Average Control Chart(EWMA) • 此法是較Shewhart control chart更具有detect small • shifts能力的control chart。 • 此法與cusum control chart是approximately equivalent。 • 通常適用於individual observation(即n=1),但亦可用 • 於n>1的情況。 • Roberts(1959)所提出。
取 ,L=2.7 (計算 的值) EWMA Control Chart Example 2 Data 見附表1,i.i.d.N(0,1) 見附表9 ,及附圖。
如何決定EWMA control chart的L值及 值 (使其與cusum的ARL相近) • 一般取 (通常取 )。 • Use smaller value of to detect smaller shifts。 • 當 大時,L=3 works reasonably well。 • 當 小時(e.g. ),取2.6≦L≦2.8。 for 不同 與L的 如Example 2,取 ,L=2.7 約與h=5、k=1/2的cusum相同。 • 見附表10,
EWMA比Shewhart chart更易detect small shift(此與 • cusum的性質相同),但對large shift則不然(i.e. 較 • Shewhart慢),可是對large shifts,EWMA又比cusum • 快detect shift(特別是當 )。 • 可利用EWMA與Shewhart chart的combination,既可保 • 留detect small shift的優點,又可改進detect large shift的 • 能力(稱為Shewhart-EWMA control procedure)。 • 此時Shewhart chart取 ,亦可以將 • 與EWMA中的 畫在同一個control chart(採用不同 • symbols 或colors)。 • 當n>1時,EWMA的應用僅須將 改為 即可。 • EWMA十分robust ,見課本p.433 Table8-11 。
EWMA的推廣 • 當 大時, ,且若 是獨立時, • 其中 • EWMS(Exponentially Weighted Mean Square Error)
由於EWMS對process mean及standard deviation均 • sensitive,故MacGregor & Harris(1993)建議將 以 • EWMA中的 取代之,而得到下面的EWMV • (exponentially weighted moving variance): • 若欲monitor process的standard deviation可採用下面的 • EWRMS(exponentially weighted root mean square)
從SPC的觀點,EWMA在monitor process及detect • assignable causes的能力,大約與cusum相同。然而從另 • 一個角度來看,EWMA更對process的mean提供一個預 • 測的值(forecast),因為 實為在時間(i+1)時對 • process mean的預測值。 • 若在computer-integrated manufacturing的過程中以 • sensor來測量每一個製造成品,此時能提供對process • mean的預測值,有助於提早矯正機器,使process mean • 回歸target value,但需注意的是不可太常矯正,否則將 • 造成process的variability變大。
Proportional adjustment Integral adjustment Differential adjustment • 由於EWMA的 為對時間i+1的預測值,故在control • chart上,我們將 對i+1畫圖。 • 以下介紹數個modify EWMA的方法,以提高其預測 • process mean的能力:
Moving Average Control Chart: w與shift的大小約成反比,即欲偵測small shift, 則採用longer-span moving average。
Example 3 Data 見附表1, w=5 見附表11 ,及附圖。 • Moving average彼此是highly correlated,故不適用runs • 等法則。 • Moving average C. C. 較Shewhart chart易detect small • shift,但通常又比cusum或EWMA detect small shift的能 • 力差,其優點是簡單、方便使用。